| Increased
sampling, both in space and time will produce a more
accurate pattern of water-quality effects on seagrass.
Areas where seagrasses do not currently grow and which
are expected to be favorable for seagrasses, because
water-quality does not exceed the threshold values,
can be further evaluated. Either the threshold values
can be changed or other factors can be implicated in
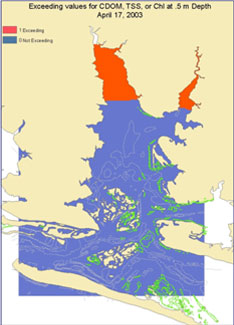
why seagrasses are not growing in those areas. The resulting
maps can be used to show the water-quality conditions
at the deep edges, and how much of each component is
present at that depth. By cross-referencing all these
factors, managers can then devise a plan to alter the
components in the water (i.e., increase water clarity)
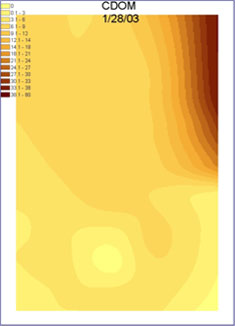
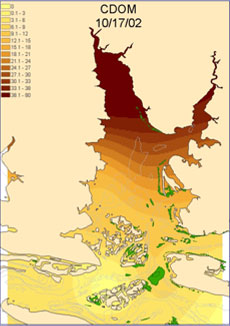
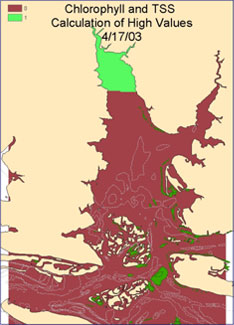
so the seagrass beds can grow into deeper waters. Of
the three components, CDOM exceeded the threshold values
most often at all depths. Future projects could include
a series of maps querying only the CDOM raster layer,
to see how often it exceeded its threshold values. If
this was related to a certain time of the year, then
that time of the year could be concentrated on as a
target for managers to try and decrease the CDOM levels.
View
the entire paper at: http://nia.ecsu.edu/ureoms2004/teams/noaa/npaxton_summer04.pdf |