|   The
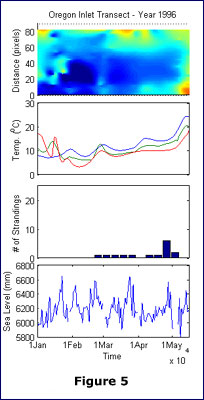
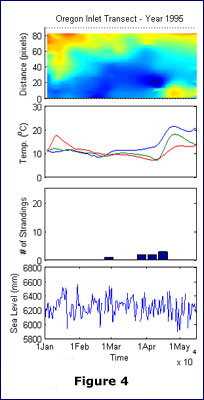
variations in sea-surface temperature for each year
demonstrated in figures 4-10 were likely to have been
occurring during a period of diverging temperatures.
As observed each year seemed to have a pattern stranding
occurring at the divergence of the temperature lines.
The blue pixel line in the temperature graph has a pattern
of ending up above the other two lines for each year.
There also seemed to be no relationship with sea height
and stranding. The
variations in sea-surface temperature for each year
demonstrated in figures 4-10 were likely to have been
occurring during a period of diverging temperatures.
As observed each year seemed to have a pattern stranding
occurring at the divergence of the temperature lines.
The blue pixel line in the temperature graph has a pattern
of ending up above the other two lines for each year.
There also seemed to be no relationship with sea height
and stranding.
In
comparison with year 1977, Mountain did a study of oceanographic
conditions in subareas 5 and 6 during the years of 1970-79.
In his paper he analyzed SST and near-bottom temperatures
between Cape Hatteras and the Gulf of Maine. It was
suggested that in years 1977-78 there was a cooling
that resulted from wintertime negative anomalies. Large
negative values were shown in the winter and spring
of Georges Bank and Middle Atlantic Bight. In his paper
Table 1 showed average SST anomalies by season and the
Mid-Atlantic Bight showed the smallest winter temperatures
(-0.65°C) between Jan-Mar, which suggested that
the later years of the 1970-79 period had extremely
cold winters.
|