|
 |
 |
|
 |
| ECSU URE/REU Summer 2016 Internships |
|
|
|
|

Jessica Hathaway
SR-MATH
hathawayjessica18@gmail.com |
NASA Langley Research Center
Mentor: Dr. Gamaliel Cherry
NASA Langley Research Center
Abstract
During the summer, I interned at NASA Langley Research Center (LaRC) in Hampton, VA. My internship gave the opportunity to work with the Digital Learning Network™ (DLN™) in the Office of Education (OEd). My work with Mr. Michael Perri, involved documenting the location of audio and visual equipment throughout the video production area. This is done yearly as part of the DLN™ inventory process so that the DLN™ knows what equipment it has and where it is located.
For Dr. Gamaliel Cherry, I worked on looking up different types of 360 degree video conferencing cameras. By using 360 degree cameras the DLN™ can effectively use one camera in the center of the room and do video conference calls without having to mount multiple cameras.
My work with Dr. Erica Alston, included analysis of the STEM-E and EPD activates using excel and Google Maps. I created summary graphs that show the frequency of the activities by name, longitude, latitude, participation type for student, parent, teacher and public. Using this same data, I created a Google map that geographically displays STEM-E and EPD activities in the OEd 5-State region. These maps showed the range of times Dr. Kim Brush visited those areas, the number of participants, and what states were visited. The purpose was to see what locations were visited and how often. This allowed for Dr. Brush to know what areas to target in the future.
My internship has sharpened my writing and helped me learn about different areas of the DLN™ and the OEd. I had the opportunity to see different aspects of studio production such as audio and video capabilities. I became familiar with statistical analysis in Excel, which will be helpful in pursuing my mathematics minor. This internship has shown me that there is a team of people to make things work; I am grateful for being a part of that team.
Keywords: Science, Technology, Engineering, Mathematics, NASA, Digital Learning Network™, 360 degree camera, Studio, Google Maps™, Excel
|
|

Ttyana Matthews
SR - CS
matthews.tatyana17@gmail.com
|
Software Engineering Internship at Apple in Cupertino, California
Mentor: Hong Zhu
Abstract
During the summer of 2016, I worked as a software engineering intern for Apple in Cupertino, California. This project consisted of developing a web application utilizing JavaScript, REST API, and tools such as Redux and React.
The experience was provided through a scholarship program designed between a partnership with Apple and the Thurgood Marshall College Fund (TMCF), known as the Apple Historically Black Colleges and Universities (HBCU) Scholars Program. As a recipient of the scholarship I was provided with: the opportunity to participate in an Apple HBCU Immersion experience in Cupertino and participate in a 12-week summer internship with Apple. Also included were a need-based scholarship award, various development activities to help prepare me for post-graduate careers, two mentors who were experienced Apple employees, and the chance to serve as Apple Ambassador during my senior year on my HBCU campus to build awareness for the Apple and TMCF HBCU initiative.
The program was introduced to me by my department chair, professors, and peers who strongly encouraged me to apply for the wonderful opportunity. After completing a series of questions pertaining to my background and technological interests, writing an essay, and submitting my resume as well as unofficial transcript, I interviewed with Apple employees. Out of 1,600 applicants, 32 HBCU students were selected to join the program in the inaugural class of scholars.
|
|

Nigel Pugh
SR - CS
migel.pugh32@gmail.com
|
Counting Faces: Computer Vision and Privacy Application for the Visually Impaired Person
Mentors: Apu Kapadia, Ph.D, Rakibul Hasan, and Patrick Shaffer
Indiana University - Research Experience for Undergraduates
Abstract
The team developed a system that will inform a visually impaired person how many people are around them utilizing a Beaglebone Black. Our system uses an infrared camera to detect the presence of an individual based on body temperature and an HD camera to capture an image. The image is then processed and an output of the number of faces in the captured image is given.
|
|

Tori Wilbon
SR - CS
toriwilbon@yahoo.com
|
Multidimensional Data Cube Data Visualization
Mentor: Vince Breneman
USDA, Economic Research Services, Information Service Division, Geographical Information Systems Research Support Branch, Washington, DC
Abstract
Explored the use of multidimensional mosaic datasets (space time cubes) for analysis and visualization with ERSI products. Software included ArcMap and ArcGIS Pro and the use of Python for automation. I used a range of climate data as well as a set of ethanol capacity intensity surfaces to explore software capabilities. I also used R to help load a large daily climate dataset into Amazons Redshift data warehouse solution.
|
|
Jefferson Ridgeway IV
SR - CS - ECSU
jdridgeway78@students.ecsu.edu
Poster PPT / JPG
Flyer PDF / WORD |
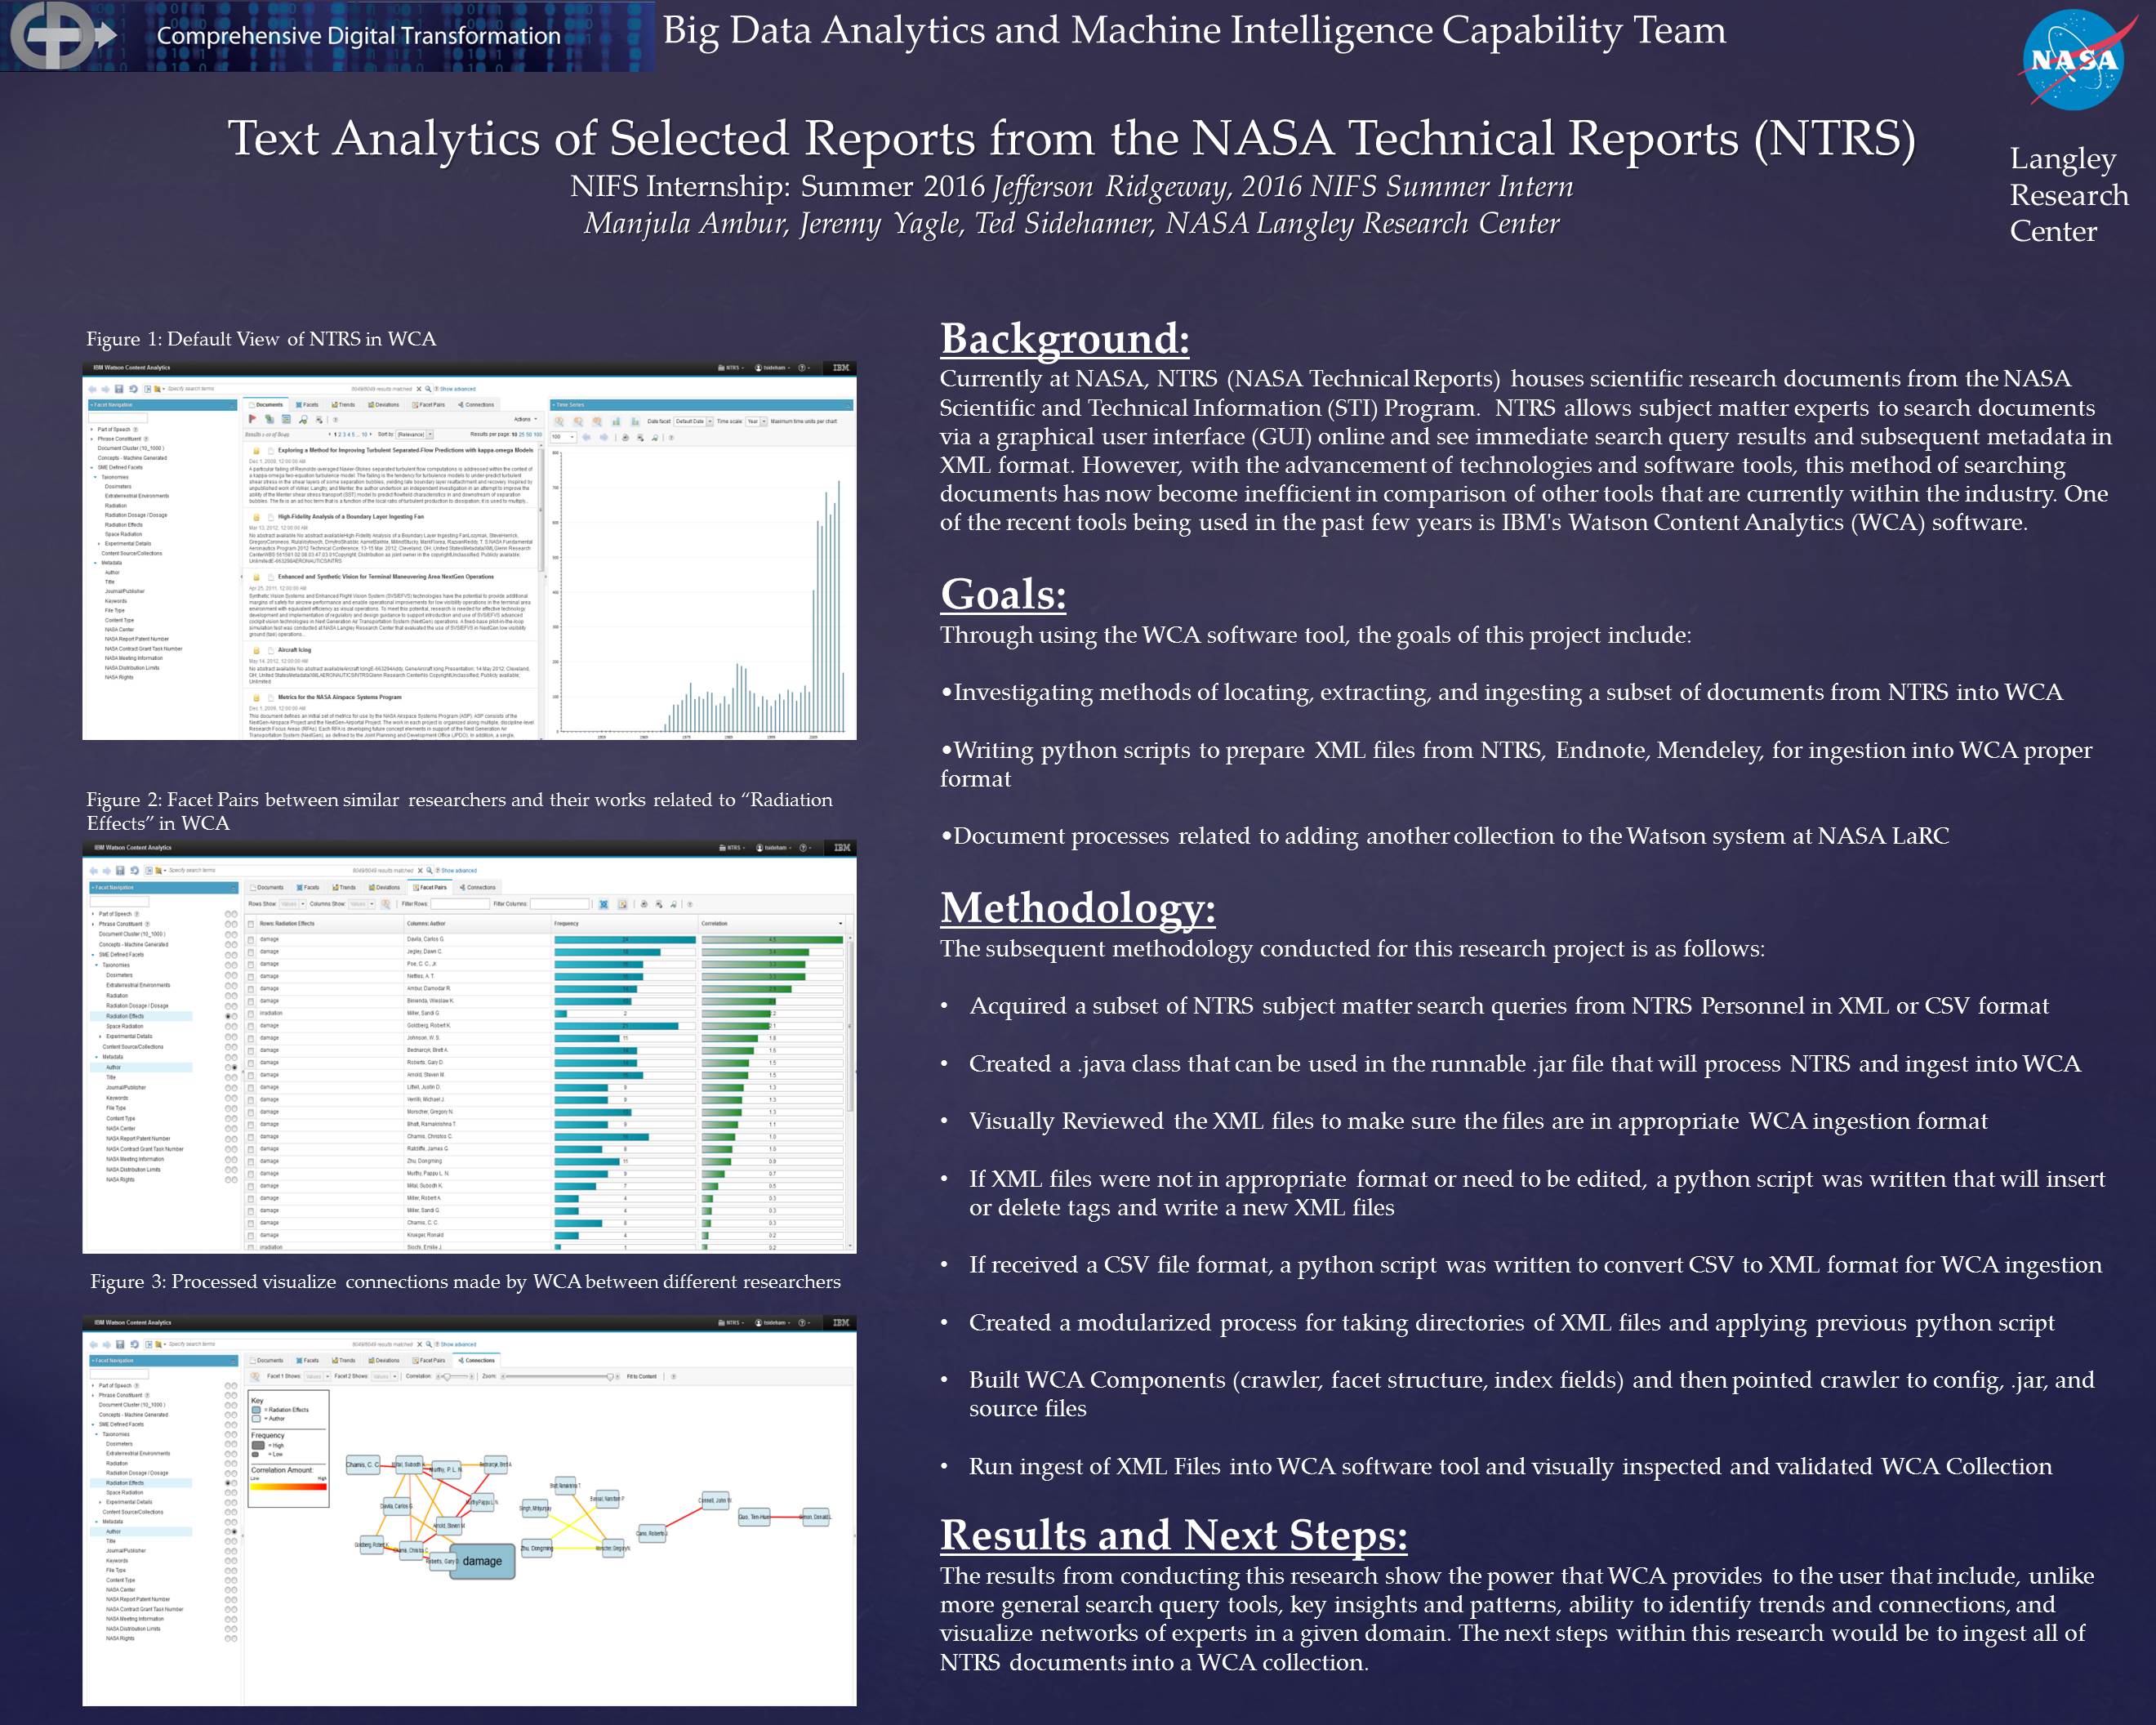
Text Analytics of Selected Reports from the NASA Technical Reports
Mentors: Manjula Ambur, Jeremy Yagle, Ted Sidehamer
NASA Langley Research Center - Big Data Analytics and Machine Intelligence Capability Team
Abstract
Currently at NASA, NTRS (NASA Technical Reports) houses scientific research documents from the NASA Scientific and Technical Information (STI) Program. NTRS allows subject matter experts to search documents via a graphical user interface (GUI) online and see immediate search query results and subsequent metadata in XML format. However, with the advancement of technologies and software tools, this method of searching documents has now become inefficient in comparison of other tools that are currently within the industry. One of the recent tools being used in the past few years is IBM's Watson Content Analytics (WCA) software.
The results from conducting this research show the power that WCA provides to the user that include, unlike more general search query tools, key insights and patterns, ability to identify trends and connections, and visualize networks of experts in a given domain. The next steps within this research would be to ingest all of NTRS documents into a WCA collection.
|
|

Tangee Beverly
SO-CS
tlbeverly681@students.ecsu.edu
|
Game Development with Big Data
Mentors: Geoffrey Fox, Ph.D, Pulasthi Supun Wickramasinghe, and Supun Kamburugamuve
Indiana University - Research Experience for Undergraduates
Project Summary
My project is about researching how big data plays an important role in game development. Also, how python connects with big data and game development.
Abstract
The game industry has come a long way from board games to extensive multi-player games with impressive graphics. Game developers create games for people's enjoyment. Big Data is a larger set of data that reveals set of patterns, trends, human behavior and interactions, so with the use of big data it plays a very important role with the gaming industry. It is used to collect the information about the gamer to keep them engaged of that particular game and use that data to help make the game better. Python is a well-known programming language that big data scientist uses to hold the big data. By learning to code with python we created a hangman game and a word counter to count the words in a text file. We are aimed in this paper to discuss the reasons and benefits for game developers to learn the python programming and understand the use of the Big Data in game development.
|
|

Joselyn Hathaway
FR-MATH
jhathaway584@students.ecsu.edu
|
The Impact of STEM Outreach in Schools and Communities
Mentor: Dr. Linda Hayden
University of Kansas - REU
Abstract
The Center for Remote Sensing of Ice Sheets (CReSIS) at the University of Kansas is a National Science Foundation (NSF) Science and Technology Center (STC) CReSIS’ K-12 Educational Outreach Program with a curriculum designed to introduce students to the dynamics of polar ice sheets and their effects on sea level rise. The Ice, Ice Baby (IIB) curriculum is a series of inquiry-based lessons developed by CReSIS K-12 Educational Outreach Staff and consists of 7 units with 31 lesson plans. Data (pre- and post-surveys from students and teachers) from the IIB program has been collected and assessed annually. This research study focuses on the impact the IIB curriculum has made on student participants in the program, their level of interests in STEM, and will examine data assessed from the student and teacher surveys from 2010 to 2015. Science, Technology, Engineering, and Mathematics (STEM) outreach programs target K-12 students and enhance student learning, comprehension skills, and helps students understand various principles related to STEM [10]. These programs are coordinated by various organizations, colleges, or universities that are staffed with STEM professionals and facilitators [4]. A major issue that schools face today is the low involvement of minority students in STEM education and careers. Research suggests ways to get students involved includes: developing discussions, hands-on activities, and incorporating STEM into lesson plans [6]. The research presented will support the effectiveness of STEM outreach programs, explain how they are essential to student learning, and the importance of encouraging students to participate in STEM.
|
|

Charles Hockaday, Jr
FR-CS
cbhockaday786@students.ecsu.edu
|
Python Tutorial for Big Data Scientists
Mentors: Geoffrey Fox, Ph.D., Supan Kamburugamuve, and Pulasthi Supun Wickramasinghe
Indiana University - Research Experience for Undergraduates
Project Summary
Will display a tutorial on how Scientists would use Python in correspondence to Big Data. Basically discussing the basics of Python.
Abstract
Python was established back in 1989 by Guido van Rossum at CWI in the Netherlands as a successor to the ABC programming language capable of exception handling and interfacing with the Amoeba operating system. For big data there is no specific thing that has to be “big” when it comes to discussing big data. Rather than that it comes down to the need for new techniques and tools in order to be able to process it. This project will determine how scientists will be able to use Python and extend it into using the program towards Big Data in the near future. People that developed Python were able to help make different tutorials and videos on how people can learn or even teach the program for others to learn at anytime. By stating this, the internet shows multiple online sources that someone can go by to learn this highly used program.
|
|

Daquan Rascoe
FR-CS
dorascoe484@students.ecsu.edu

Derek Morris
GRAD - CS - ECSU
dmow4454@gmail.com

Cornelius Holness
GRAD - CS - ECSU
dmow4454@gmail.com
|
Analyzing Long-Term Drought Effects on Land Surface Temperature and Vegetation Using National Oceanic Atmospheric Administration Satellite’s Data
Mentor: Andrew Brumfield
ECSU Research Experience for Undergraduates
Abstract
Analyzing the effects of Drought in the Northeastern North Carolina area with NOAA satellite products to determine a correlation between Land Surface Temperature and Vegetation. The Palmer Drought Severity Index (PDSI) data sets for summer 2002 -2013, provided by the State Climate Office of North Carolina NC CRONOS database, provided evidence that since 2007 the northern coastal plain of North Carolina has been experiencing a long-term summer drought. Summer is defined as the months between late June to late September.
Utilizing Elizabeth City State University’s (ECSU) 1.5m L-band SeaSpace ground station the team received live Advanced Very High Resolution Radiometer (AVHRR) imagery from NOAA polar orbiting satellites each day for the month of June. The primary goal of this research was to observe the correlation between land surface temperature (LST) and Normalized Difference Vegetation Index (NDVI) due to long-term drought using NOAA satellite data. In the month of June 2016, the team collected imagery data through the SeaSpace© TeraScan® system and produced LST and NDVI. Various GPS locations were selected in Northeastern North Carolina of different biomes such as swamp lands, grasslands, and farmlands. The team collected and utilized data in the areas of Camden County, Gates County, Pasquotank County, and Perquimans County. Using the SeaSpace Graphical User Interface (GUI) Teravision®, The data points of each product at the various biome locations were analyzed for daily and weekly averages.
Using the GPS locations found in United States Geological Survey (USGS) of the swamps lands, grasslands, and farmlands were entered and saved as survey points in TeraVision’s GUI. All of the passes in the month of June that were received and processed into LST and NDVI products at the direct broadcast ground station at ECSU were loaded into TeraVision. The values were then extracted from each of the points and evaluated by their biome specific location for LST and NDVI. With Excel the team conducted analysis for daily trends, regional trends, biome trends, and weekly trends.
|
|

Hagen Hodgkins
SO-CS
hagen.hodgkins@gmail.com
|
Ansible/Devops in Big Data
Mentor: Geoffrey Fox, Ph.D.,
Indiana University - Research Experience for Undergraduates
Project Summary
Creating ansilbe role that allow those working in big data to download and install prerequisites for their projects to machines without the need to have the roles located in each repository it is required in, potentially leading to duplicates.
ABSTRACT
When developers need to set up a new machine with the intent to use it as a development environment they must go through the hassle to create a list of what they need. They must then proceed to individually download each of the programs and dependencies that they would require for their machine to be viable for the development of projects. The creation of an automated system for downloading a preexisting list of programs and dependencies would allow a developer to skip this step entirely and relatively quickly delve into their development tasks. With this in mind we applied DevOps concepts and worked with ansible to create a role that did just this. We then applied the benefits of ansible role automation to a big data project which had several roles built into it that otherwise should be absent from the project's repository. As such we created individual repositories to host the roles and created an ansible document within the project that would call these roles should they be needed.
|
|

Joel Gonzales-Santiago
SR-BUS(RS)
jugonzalez-santiago@students.ecsu.edu
Poster |
Juneau Icefield Research Program
Mentors: Lara Hughes-Allen and Uwe Hoffman
Juneau, Alaska
Abstract
Glaciers are retreating at unprecedented rates worldwide. Past studies of the Juneau Icefield show that 50 glaciers have receded, two have remained stationary and one has advanced. The advancing glacier, the Taku, is the primary glacier of this study. As a part of the Juneau Icefield Research Program, glacier surface elevation and short-term velocity are measured annually during the summer season along longitudinal and transvers profiles using a Trimble Global Positioning System (GPS).
In order to better understand the data we are collecting through our measurements, we have compared our survey results from 2016 to those of recent decades to determine long-term changes in surface elevation and velocity over time. In addition, we have generated a detailed surface model and measured the pattern of local surface flow to constrain the location of the Matthes-Llewellyn divide, to determine if it is migrating through time. These results will help us understand the evolving dynamics of the Taku Glacier and the rest of the Juneau Icefield, while continuing to build a database that can be utilized in future research.
|
|

Kevin Benton
SO-CS
kevinbenton46@yahoo.com
Paper (PDF/Word)
PowerPoint (PDF/PPT)
Poster (PPT/JPG) |
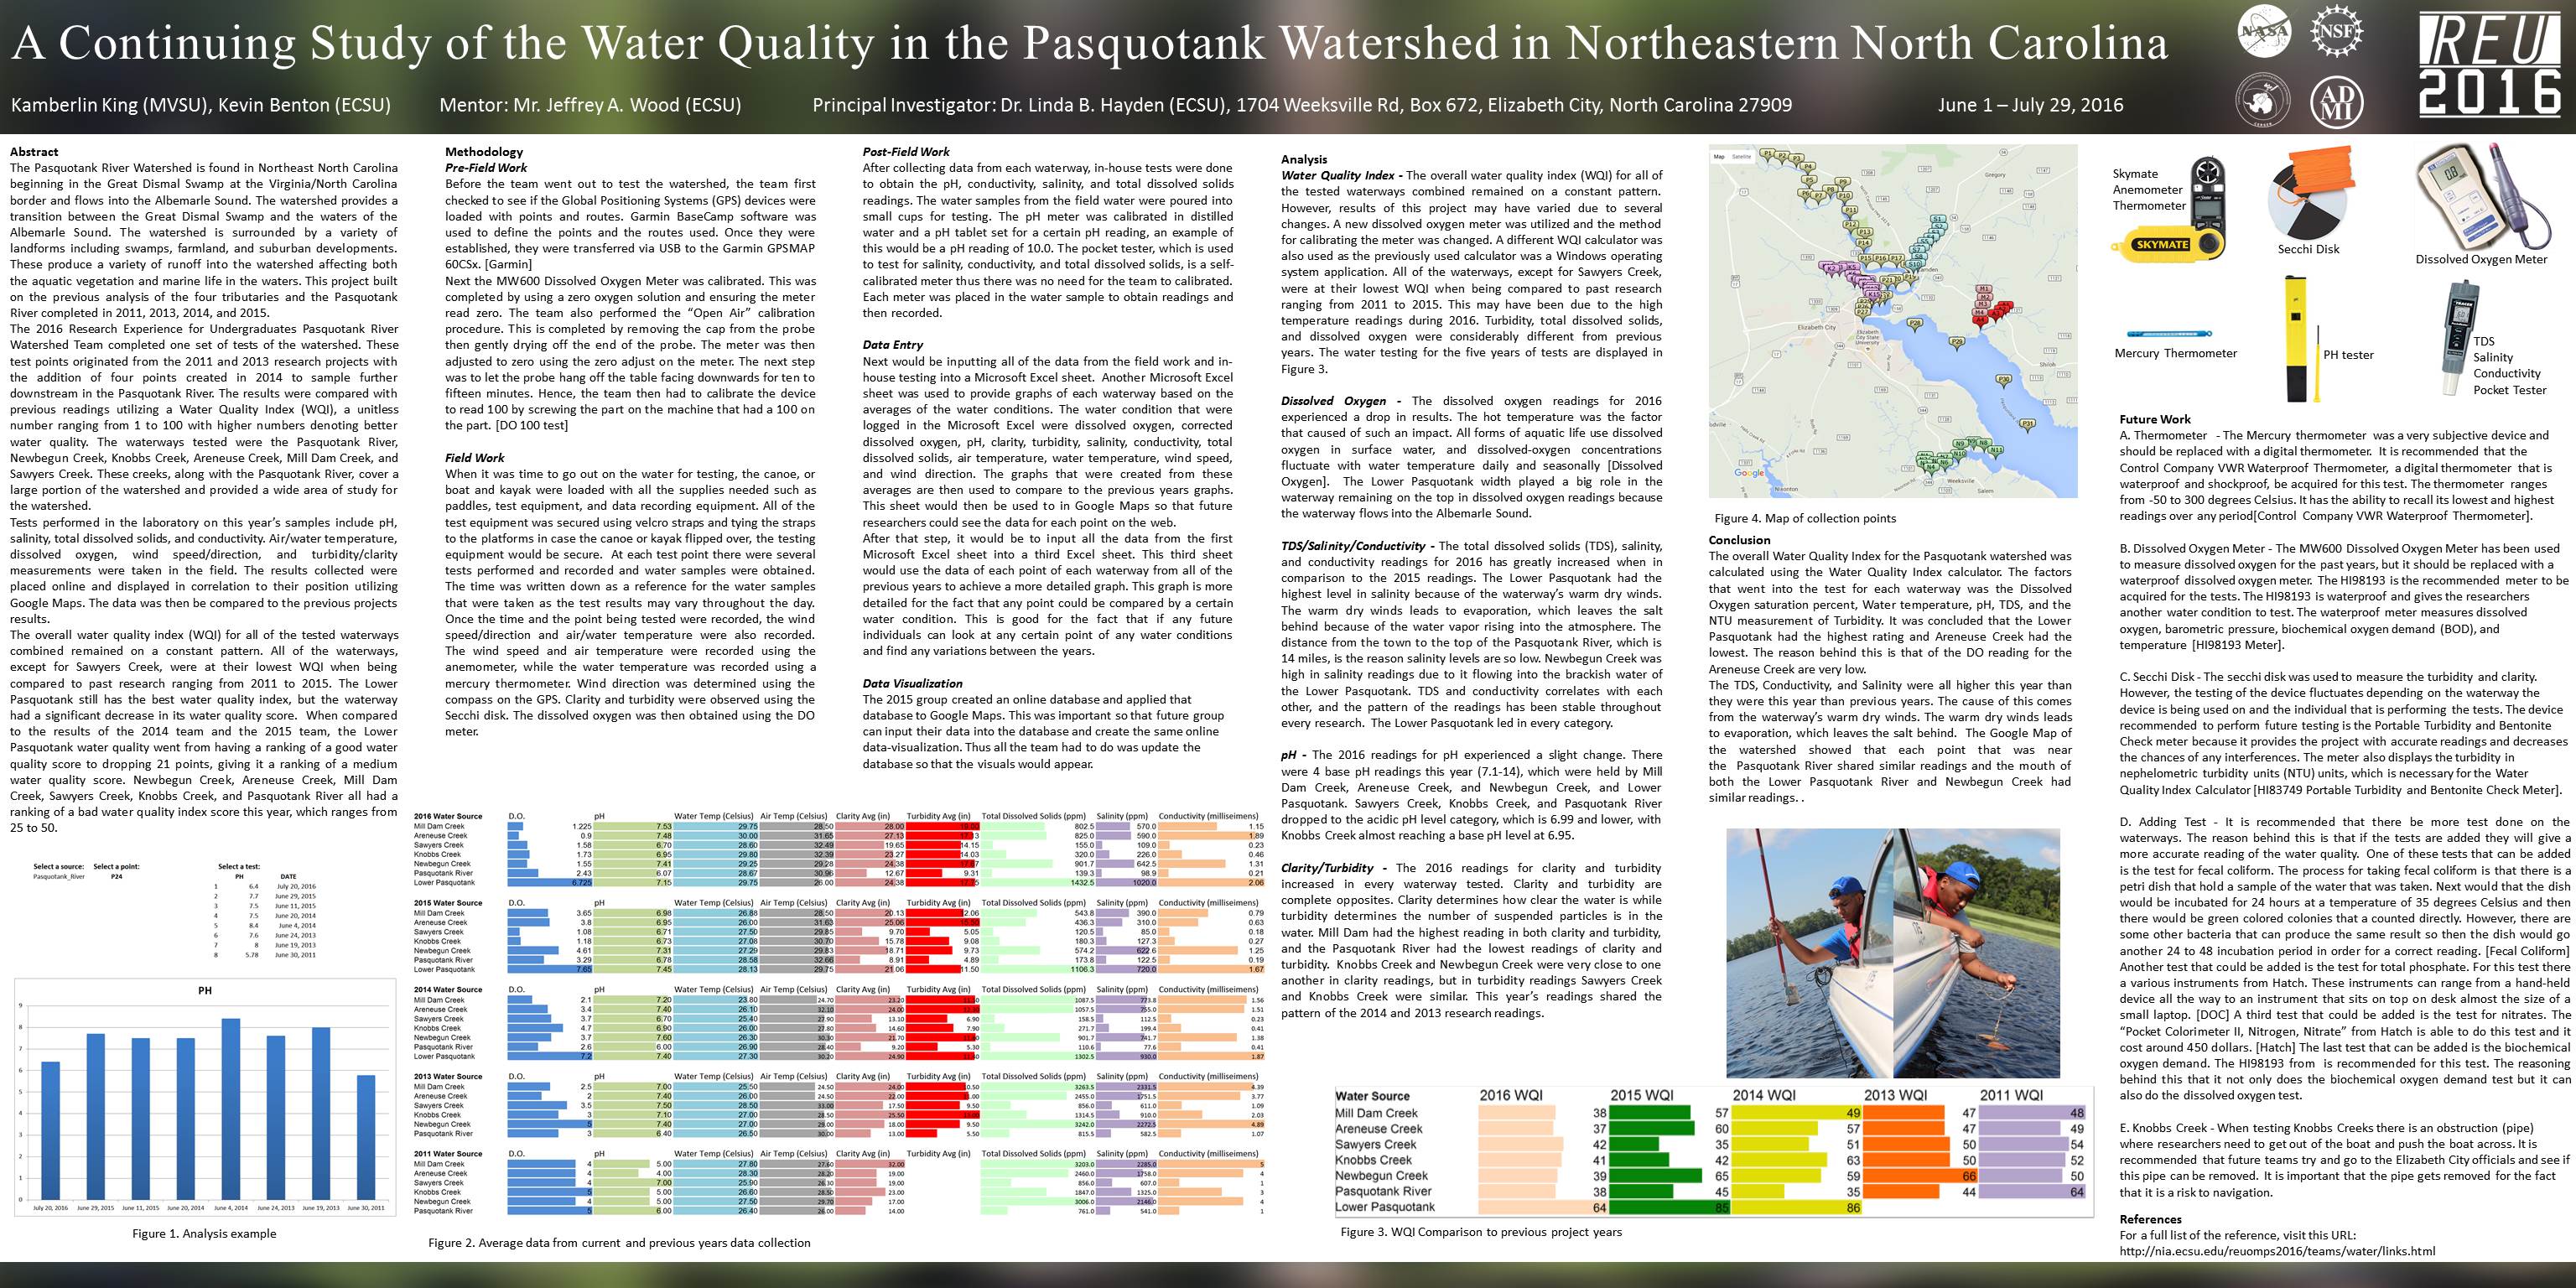
A Continuing Study of the Water Quality in the Pasquotank Watershed in Northeastern North Carolina
Mentor: Jeff Wood
ECSU Research Experience for Undergraduates
Abstract
The Pasquotank River Watershed is found in Northeast North Carolina beginning in the Great Dismal Swamp at the Virginia/North Carolina border and flows into the Albemarle Sound. The watershed provides a transition between the Great Dismal Swamp and the waters of the Albemarle Sound. The watershed is surrounded by a variety of landforms including swamps, farmland, and suburban developments. These produce a variety of runoff into the watershed affecting both the aquatic vegetation and marine life in the waters. This project built on the previous analysis of the four tributaries and the Pasquotank River completed in 2011, 2013, 2014, and 2015.
The 2016 Research Experience for Undergraduates Pasquotank River Watershed Team completed one set of tests of the watershed. These test points originated from the 2011 and 2013 research projects with the addition of four points created in 2014 to sample further downstream in the Pasquotank River. The results were compared with previous readings utilizing a Water Quality Index (WQI), a unitless number ranging from 1 to 100 with higher numbers denoting better water quality. The waterways tested were the Pasquotank River, Newbegun Creek, Knobbs Creek, Areneuse Creek, Mill Dam Creek, and Sawyers Creek. These creeks, along with the Pasquotank River, cover a large portion of the watershed and provided a wide area of study for the watershed.
Tests performed in the laboratory on this year’s samples include pH, salinity, total dissolved solids, and conductivity. Air/water temperature, dissolved oxygen, wind speed/direction, and turbidity/clarity measurements were taken in the field. The results collected were placed online and displayed in correlation to their position utilizing Google Maps. The data was then compared to the previous projects results.
The overall WQI for all of the tested waterways combined remained in a constant pattern. All of the waterways, except for Sawyers Creek, were at their lowest WQI when being compared to past research ranging from 2011 to 2015. The Lower Pasquotank still has the best water quality index, but the waterway had a significant decrease in its water quality score. When compared to the results of the 2014 team and the 2015 team, the Lower Pasquotank water quality went from a good Water Quality Index score to a medium Water Quality Index score, dropping 21 points. Newbegun Creek, Areneuse Creek, Mill Dam Creek, Sawyers Creek, Knobbs Creek, and the Pasquotank River all had bad Water Quality Index scores this year.
|
|
|
| |
|
|
|
|
|
|
|
 |
Elizabeth City State University does not endorse, sponsor or provide material located on this site. |
| |
|

