|
 |
 |
|
 |
| ECSU URE Summer 2009 Internships |
|
|
|

Patrina Bly
Junior - MATH
blbly@mail.ecsu.edu
Research PowerPoint
Research Paper (PDF)
Research Poster (JPG) |
The Applicability of Geographic Information Systems (GIS) and Remote Sensing in Identifying Polybrominated Diphenyl Ethers (PBDEs) sources using NOAA National Status & Trends Mussel Watch Program Data
Mentor: Michael A. Edwards
internship title
Abstract
With an ongoing assessment of more than two decades, the Mussel Watch Program is one of the longest running contaminant monitoring programs in the coastal ocean with more than 20 years of data. Mussel Watch uses bivalves (Mussels, Oysters, and Zebra Mussels) as a means to assess water quality. The purpose of the program is geared towards assessing contaminants nationally.
Utilizing formats such as Geographic Information Systems (GIS) and Remote Sensing data assessment, an attempt will be made within this project to identify possible releasers of effluent waste into the major coastal watershed regions pertaining to ongoing research conducted within monitored mussel watch sites. The categorization of possible contaminating locations will be made available through the development of a large dataset. This dataset will utilize those derived from agencies such as the United States Environmental Protection Agency (U.S. EPA) and other state government databases such as the National Oceanic and Atmospheric Administration (NOAA), and the United States Geological Survey (USGS).
Utilizing platforms such as ESRI® ArcMap™ software, spatially referenced locations, via point data, vector data, line data, and polygons depicting points and sites of interest will be created using latitude and longitude information. Points and areas of interest (AOI) will be verified using Remote Sensing imagery. As such, Polybrominated Diphenyl Ethers (PBDEs) within observable mussel watch sites will be assessed by NOAA’s Center for Coastal Monitoring and Assessment (CCMA). Using this data, researchers will be able to identify possible sources of contributors to the present contaminant. |
|

Justin Deloatch
Junior - CS
justindeloatch07@yahoo.com
Research Paper (PDF)
Research Presentation |
Artificial Intelligence: Navigating Polygonal Obstacles Using Searching Techniques
Mentor: Dr. Jamiiru Luttamaguzi
Ronald E. McNair Post baccalaureate Achievement Program
Abstract
The project used artificial intelligence searching techniques to find a path around polygonal obstacles on a plane. The solution was based on both non-informed and informed algorithms. The algorithms are compared and contrasted. Each of these algorithms will work on the problem represented in terms of states and transitions between them. The algorithms then find a path to a goal state by choosing one segment at a time. Java programming was used to implement the algorithms and present the solution in a graphical user interface. |
|

MyAsia Reid
Junior - CS
myasia08@aol.com

Michael Jefferson
Junior - CS
michaeljefferso@yahoo.com
Research Paper (PDF)
PowerPoint
Poster
Web Site |
Automatic Ice Thickness Estimation from Polar Subsurface Radar Imagery
Mentor: Christopher Gifford
CReSIS
Abstract
This work focuses on automating the tedious task of estimating ice thickness from airborne radar data acquired over Greenland and Antarctica. This process involves the identification and accurate selection of the ice sheet's surface location and interface between the ice sheet and underlying bedrock for each measurement. Knowing the surface and bedrock locations in the radar imagery allows us to compute ice sheet thickness, which is very important for the study of ice sheets, their volume, and how they may contribute to climate change issues. The previous time-consuming manual approach required sparse hand-selection of surface and bedrock interfaces by several human experts, and interpolating between selections to save time. Two primary methods have been studied: edge-based, and active contour. Results are compared and presented in terms of time requirements, error, and advantages which each method offers. Automatic ice thickness estimation results from 2006 and 2007 Greenland field campaigns show that the edge-based approach offers faster processing (seconds compared to minutes), but suffers from a lack of continuity and smoothness aspects that active contours provide. The active contour approach is more accurate when compared to ground truth selections from human experts, and has proven to be more robust to image artifacts.
|
|

Tiwana Walton
Senior - CS
tlwalton@mail.ecsu.edu
PowerPoint |
High Level Aviation Safety Risk Assessment
Mentor: Sharon Monica Jones
NASA Cooperative Education Program
Abstract
Prior methods for calculating aviation safety risk assessments were labor intensive. The purpose of this research is to find an alternative method for conducting aviation safety risk analysis in support of the portfolio assessment for Integrated Resilient Aircraft Control (IRAC) Project within the NASA Aviation Safety (AvSafe) Program. A literature search is being conducted to find high level technology aviation risk assessment methodologies and structured data collection methods for use with subject matter experts. As a result of the literature search, strong consideration has been placed on applying the Delphi Method to conduct future aviation safety analysis using risk matrices and decision support software.
|
|
|
|
|

Robyn Evans
Sophomore - Math
rrevans@mail.ecsu.edu

JerNettie Burney
Sophomore - CS
jaburney@mail.ecsu.edu
Research Page
Research Paper (PDF)
Research Poster (JPG)
PowerPoint
|
A Comparative Analysis of Localized Command Line Execution, Remote Execution through Command Line, and Torque Submissions of Matlab(R) Scripts for the Charting of CReSIS Flight Path Data
Mentor:
Je'aime Powell
Undergraduate Research Experience in Ocean, Marine, and Polar Science, ECSU
Abstract
The Polar Grid team was tasked with providing the Center for the Remote Sensing of Ice Sheets (CReSIS) with data that would allow signal processing through the CReSIS Synthetic Aperture RADAR Processor (CSARP) to utilize clustered computing resources without the need of MATLAB’s® proprietary Distributed Computing Environment. This research centered on the use of MATLAB® through command line, and scripted distribution through TORQUE high performance computing scheduling.
The team used flight path information from the Greenland 2007 field deployment. This data was imported into MATLAB® so that they could be converted from text files into actual MATLAB® script files. With these MEX files, the team was able to create a script within MATLAB® that could plot the flight path data into a graph with the axes of the graph being labeled latitude for the x-axis and longitude for the y-axis.
The team took the master script for the creation of the chart and ran jobs through the command line of MATLAB® to Madogo [Elizabeth City State University’s Cluster] and Quarry [Indiana University’s Cluster]. The team was then able to compare execution times from the jobs of Madogo versus Quarry. A second comparison was then tested with TORQUE job submission versus MATLAB® submission to see which performed with greater efficiency. Lastly the average execution times of all three data sets were statistically compared with a 5% significance level to determine if there was a statistically significant difference between the use of command line jobs verses TORQUE submission. The paper focuses upon the procedure used in order to complete the research along with the conclusion reached. |
|
|

Jean Bevins
Sophomore - CS
twin-j@hotmail.com

Joyce Bevins
Sophomore - CS
blessed1989@hotmail.com
Research Poster (JPG)
Magazine Article
|
Creating Social Networking Applications for PolarGrid Facebook, by Applying Facebook Application Programming Interface
Mentor:
Marlon Pierce
2009 STEM (Science Technology Engineering and Math) Summer Scholars Institute at Indiana University, Bloomington Campus
Abstract
One primary focus of this study was to create a social networking application for PolarGrid by using Facebook Application Programming Interface (API). In completing such, our involvement consisted of a research project to learn the usage of web technologies to provide a way for collaborators to access PolarGrid data and apply simple filters.
PolarGrid, a research project and partnership that seek into the depths of computing infrastructure used to study that of glacial melting, and CReSIS (The Center for Remote Sensing of Ice Sheets), a Science and Technology Center, work hand to hand together. CReSIS does the physical work by going out to the fields collecting ice sheet radar data through remote sensing. PolarGrid provides computer support for the field operations and also supports large-scale analysis of the data after it is returned from the field.
Facebook API is the foundation for building applications on a Facebook platform. Found on the Facebook Developers community page, users have the option of creating or altering an application.
This Social Networking Application also contained data such ice sheet data taken from Greenland from the PolarGrid project. The subglacial terrain images give out ice sheet thickness and the details of internal ice layers over vast areas from both the surface and the air. The purpose of filtering the images is to remove disfigure noise, which usually appears as random grainy patterns. Applying proper filters will enhance the image quality and improve the understanding of subglacial structures. |
|

|
Visualization of the CReSIS Greenland Data Sets for the Polar Grid High Performance Computing System
Mentor:
Jeff Wood
Undergraduate Research Experience in Ocean, Marine, and Polar Science, ECSU
Abstract
The Center for Remote Sensing of Ice Sheets (CReSIS) has been compiling Greenland ice sheet thickness data since 1993. The airborne program utilizes a 150 MHz radar echo sounder to measure the ice thickness. The data is currently available on the CReSIS web site in various formats including PDF, Matlab, and plain text files. These formats are not readily usable in the classroom environment as a visual representation of the ice depth is not available for each expedition.
During the Undergraduate Research Experience in Ocean, Marine and Polar Science 2009 program, the Greenland Data Visualization Team took the CReSIS data and created a 4-D visualization consisting of depth, time, latitude, and longitude. This visualization was created utilizing HTML, JavaScript, and PHP. Microsoft Excel was used to filter the raw data downloaded from the CReSIS site. The team then statistically analyzed the Greenland ice sheet thickness data for calculated, missing, and actual depth readings. The goal of this project was to present the CReSIS data via the web in a visual format to elementary, undergraduate, and graduate students for research and education. This visualization package and corresponding data will eventually be migrated to the Elizabeth City State University Polar Grid High Performance Computing System. |
|

|
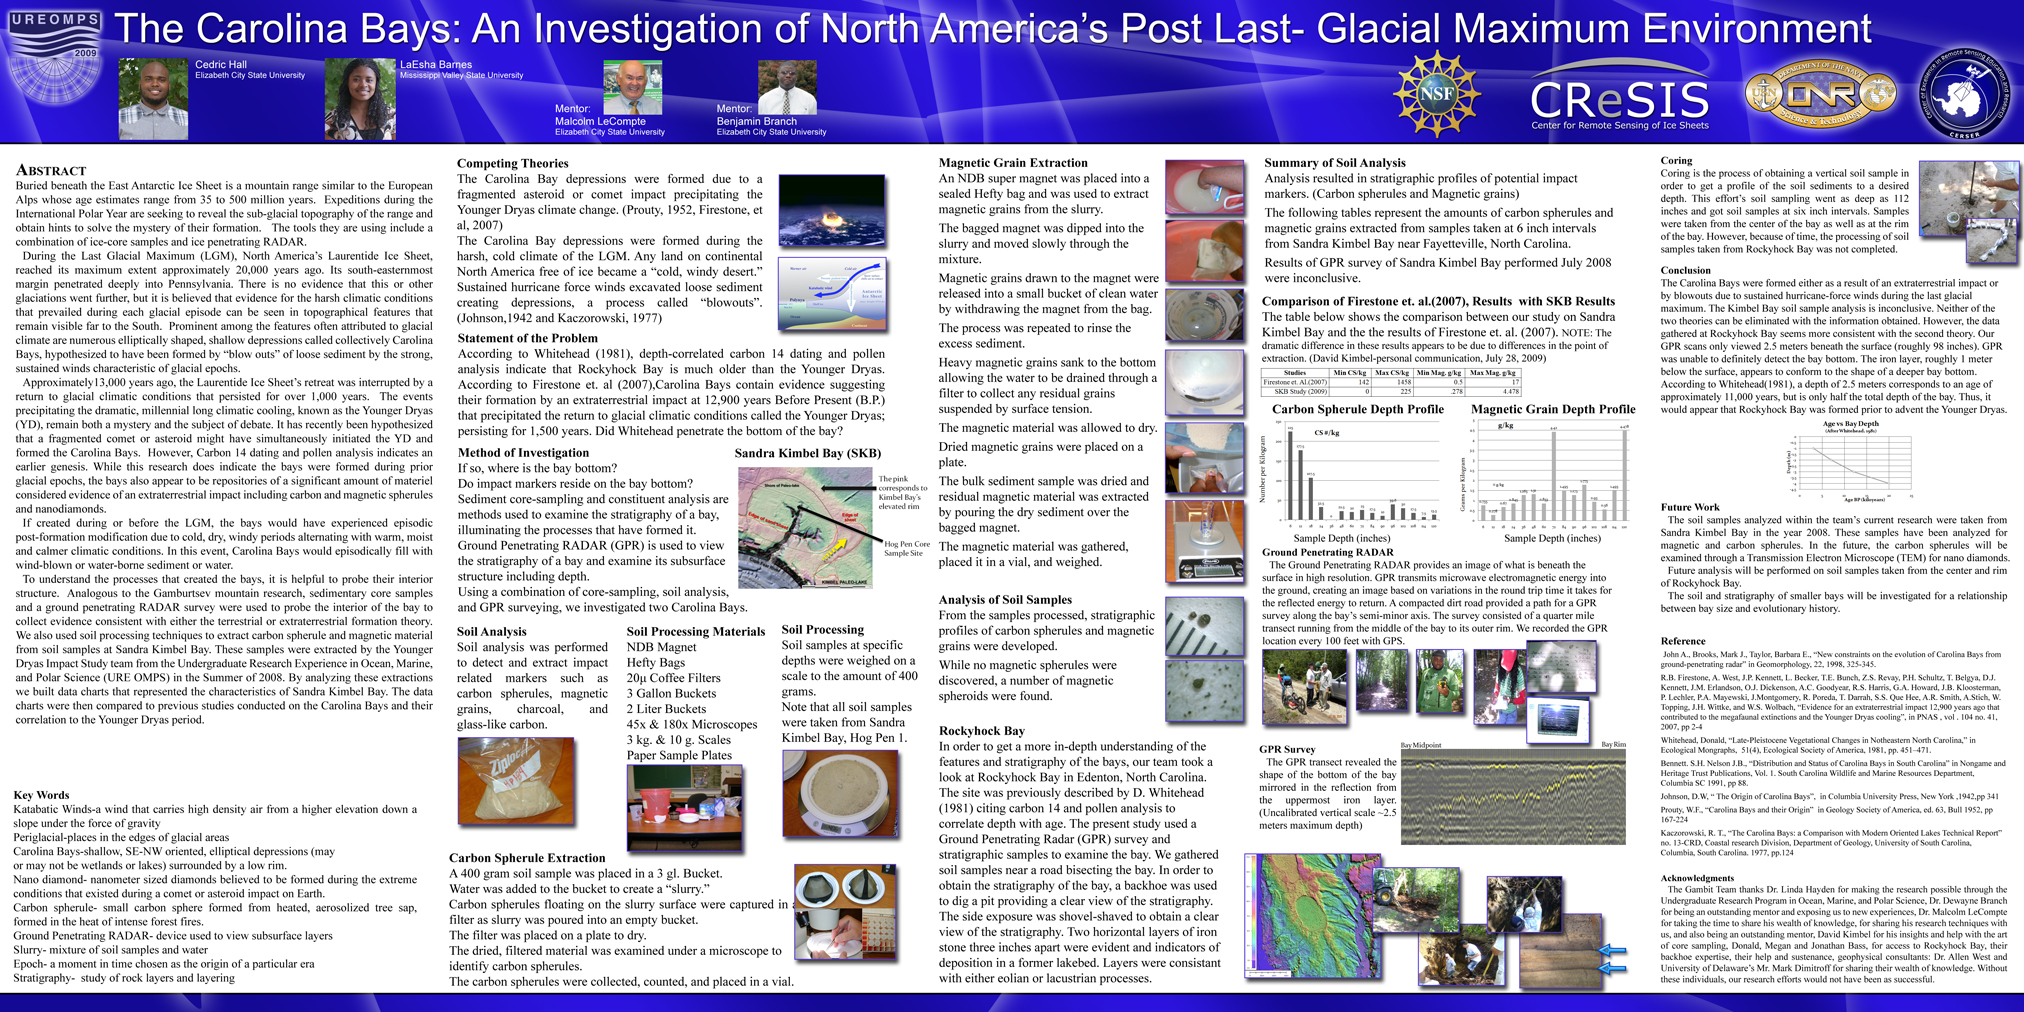
The Carolina Bays: An Investigation of North America’s Post Last-Glacial Maximum Environment (LGM)
Mentor:
Dr. Dewayne Branch, Dr. Malcolm LeCompte
Undergraduate Research Experience in Ocean, Marine, and Polar Science, ECSU
Abstract
Buried beneath the East Antarctic Ice Sheet is a mountain range similar to the European Alps whose age estimates range from 35 to 500 million years. Expeditions during the International Polar Year are seeking to reveal the sub-glacial topography of the range and obtain hints to solve the mystery of their formation. The tools they are using include a combination of ice-core samples and ice penetrating RADAR.
During the Last Glacial Maximum, North America’s Laurentide Ice Sheet, reached its maximum extent approximately 20,000 years ago. Its south-easternmost margin penetrated deeply into Pennsylvania. There is no evidence that this or other glaciations went further, but it is believed that evidence for the harsh climatic conditions that prevailed during each glacial episode can be seen in topographical features that remain visible far to the South. Prominent among the features often attributed to glacial climate are numerous elliptically shaped, shallow depressions called collectively Carolina Bays, hypothesized to have been formed by “blow outs” of loose sediment by the strong, sustained winds characteristic of glacial epochs.
Approximately13,000 years ago, the Laurentide Ice Sheet’s retreat was interrupted by a return to glacial climatic conditions that persisted for over 1,000 years. The events precipitating the dramatic, millennial long climatic cooling, known as the Younger Dryas, remain both a mystery and the subject of debate. It has recently been hypothesized that a fragmented comet or asteroid might have simultaneously initiated the YD and formed the Carolina Bays. However, Carbon 14 dating and pollen analysis indicates an earlier genesis. While this research does indicate the bays were formed during prior glacial epochs, the bays also appear to be repositories of a significant amount of materiel considered evidence of an extraterrestrial impact including carbon and magnetic spherules and nanodiamonds.
If created during or before the LGM, the bays would have experienced episodic post-formation modification due to cold, dry, windy periods alternating with warm, moist and calmer climatic conditions. In this event, Carolina Bays would episodically fill with wind-blown or water-borne sediment or water.
To understand the processes that created the bays, it is helpful to probe their interior structure. Analogous to the Gamburtsev mountain research, sedimentary core samples and a ground penetrating RADAR survey were used to probe the interior of the bay to collect evidence consistent with either the terrestrial or extraterrestrial formation theory. |
|
| |
|
|
|
|
|
|
 |
Elizabeth City State University does not endorse, sponsor or provide material located on this site. |
| |
|

