RESULTS
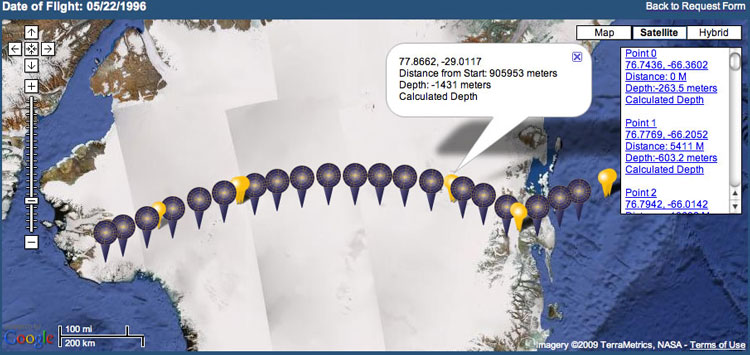
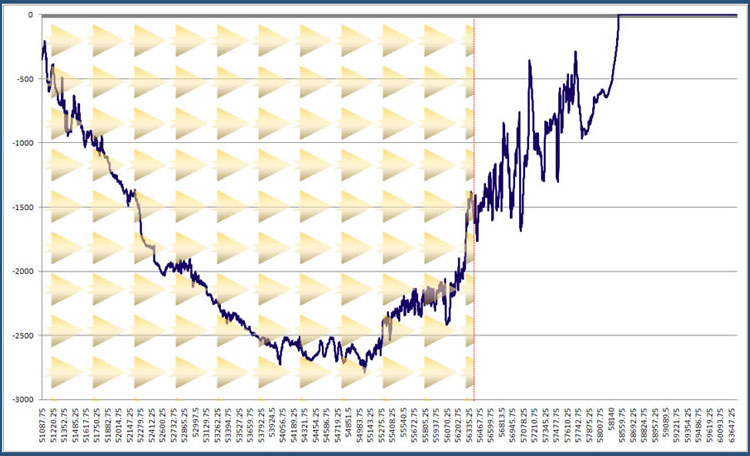
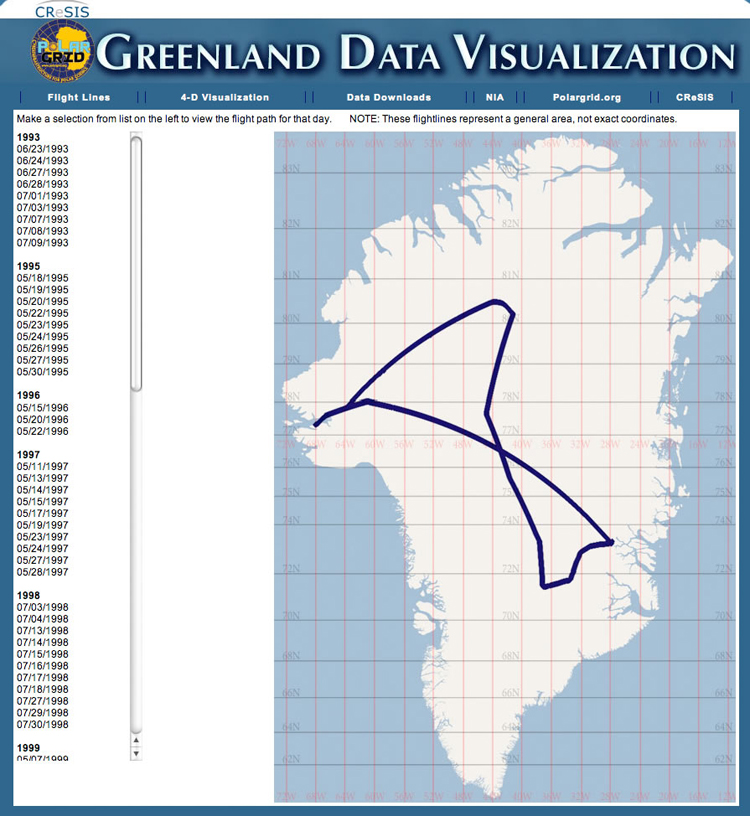
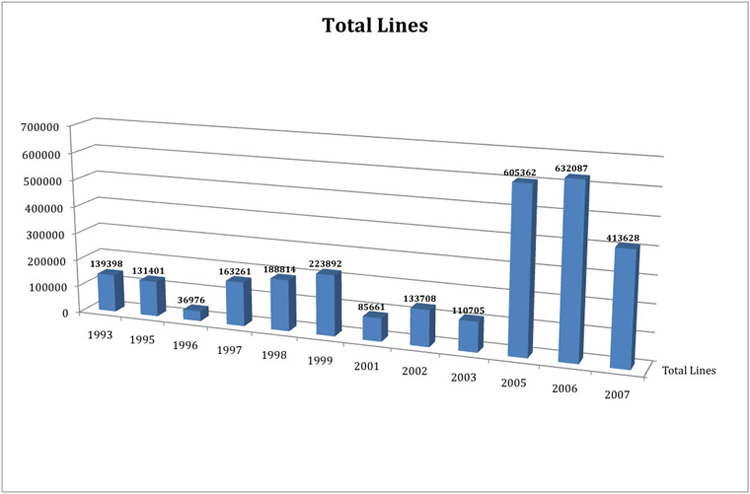
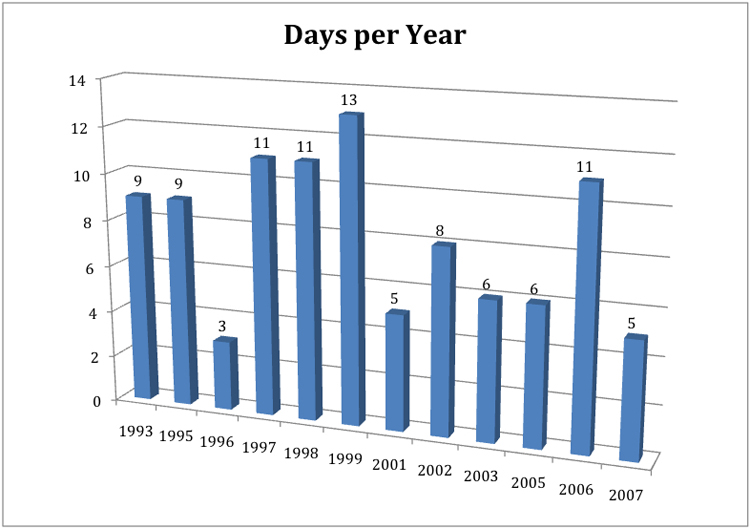
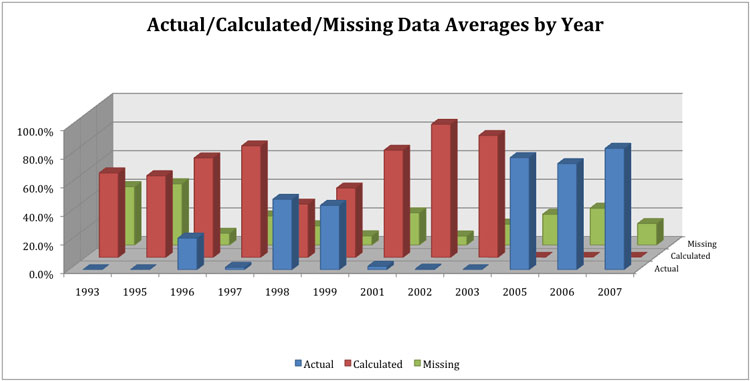
The Greenland Data Visualization team goal was to effectively and clearly communicate data collected during the Greenland expeditions from 1993 to 2007. The team made scatter plots and line graphs on Excel to convey the flight paths and depth lines. Also, the team was able to produce a 4-D image consisting of time, depth, latitude, and longitude using the Google Map application. The data that our team used was collected by the CReSIS project. In addition, the team utilized Excel to statistically analyze the Greenland ice sheet thickness data for calculated, missing, and actual depth readings.
The PHP script in this project parsed the CSV files into separate variables and created JavaScript code to be used by Google Maps. JavaScript was used in combination with PHP in order to present the CReSIS data via the web in a visual format to elementary, undergraduate, and graduate students for research and education.
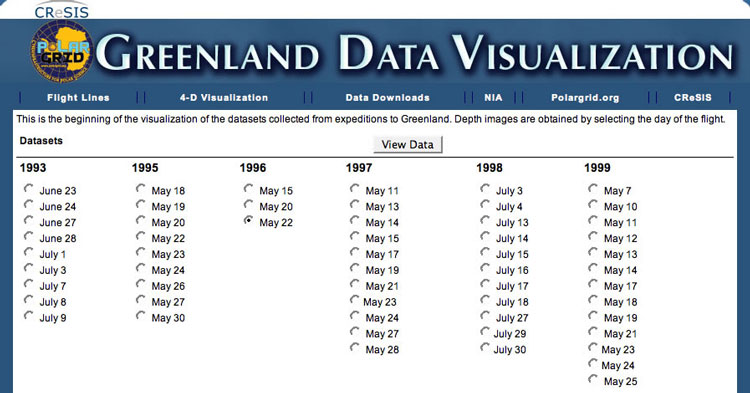
Flight Lines
http://mmt.cs.ecsu.edu/pgdataviz/pg-data-set-flightlines.php
4-D Visualization
http://mmt.cs.ecsu.edu/pgdataviz/pg-data-set-request.php
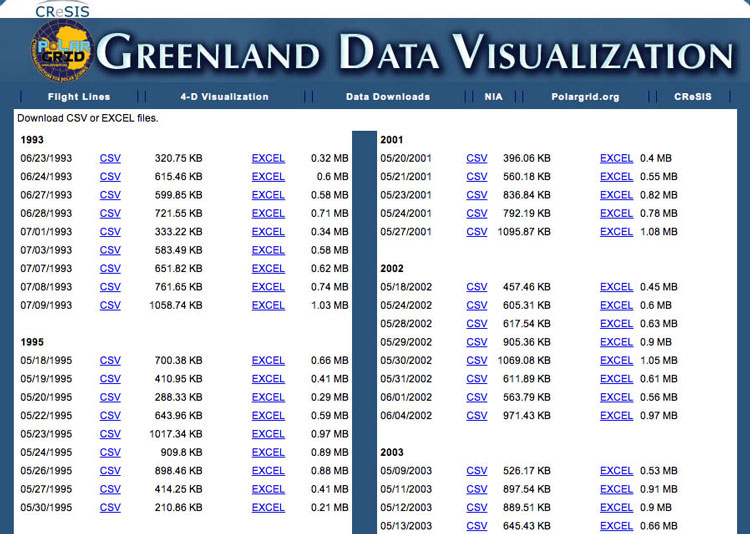
Data Downloads
http://mmt.cs.ecsu.edu/pgdataviz/dd.php