|
 |
 |
|
 |
| ECSU URE Summer 2010 Internships |
|
|
|

Patrina Bly
Senior - MATH
blbly@mail.ecsu.edu
PowerPoint |
Spatial Assessment of the Gulf of Mexico & Coral Reef Fisheries with an Emphasis on the 2010 Deepwater Horizon Oil Spill
Mentor: Carlos Rivero
DOC/NOAA/NMFS/SEFSC
Abstract
On April 22, 2010, British Petroleum operated Deepwater Horizon sank 40 miles off the coast of Louisiana. In a span of weeks the event led to the largest ecological disaster in United States history. To date, no definite numbers exists for the amounts of oil that were released into the Gulf of Mexico however, estimates exceed well past the million marks. On July 15, 2010, a temporary stop to the oil spill occurred with the placement of a cap. Currently, relief wells to allow permanent termination of the flow are being drilled with completion expected in August 2010.
Through the development of a spatial application, an assessment using GIS was made to view the extents of the 2010 Deepwater Horizon oil spill. Data concerning environmental factors, most of which concern identified National Marine Sanctuaries, and cold water coral populations ,were collected from the National Oceanic and Atmospheric Administration and displayed. Daily imagery of the oil extents were provided on a weekly basis from an independent source, georeferenced, projected, and digitized using ArcMap. Using Oracle SQL developer, benthic permitted fisheries were identified within the vessel monitoring system (VMS) database, exported, integrated within Microsoft Access, and then imported into ArcMap to be projected to show locations of fishing grounds. In addition, the series of current fishery closures were adopted the from NOAA Fisheries Service, Southeast Regional Office, incorporated into the GIS application and viewed simultaneously as major component of the assessment. Other identifiable components include point location of the Deepwater Horizon incident, visible shoreline for the impacted regions, and bathymetric contours.
The overall completion of this assessment is intended to yield a product that is conducive in viewing both deep sea coral populations and fisheries as it relates to benthic specified permitted vessels. In light of the Deepwater Horizon incident, the implementation of the assessment is to be utilized as an aid in viewing potentially at risk coral communities, fishing industry, and associated incident impact. |
|

Justin Deloatch
Senior - CS
justindeloatch07@yahoo.com
Poster (PPT)
|
The Spectral Reflectance of Ship wakes between 400 and 900 nm
Mentor: Dr. Jinchun Yuan
Program
Abstract
The objective of this research is to define the spectral reflectance characteristics of ship wakes at high spatial and spectral resolution, for the purposes of identifying maritime traffic using optical remote sensing data. The Hyperspectral Imager of the Coastal Ocean (HICO) was flown over the Hawaiian coast in April 2010. Hyperspectral images of the wake produced by the United States Coast Guard vessel, Kittiwake, traveling at speeds of 7, 14, and 21 knots were acquired. Analysis of the spectral reflectance data reveals a) that the spectral reflectance of the wake is distinct from that of background (i.e. deep ocean and sun-glint), and b) that systematic differences in the spectral reflectance properties of the wake, both along and across its long axis, as a function of vessel speed. Statistical analysis of the data indicate that the reflectance properties of the wake are significantly different to the ambient background but that the degree of difference decreases exponentially as spatial resolution increases. These results provides insights into how similar instruments operating from low Earth orbit can be expected successfully detect the presence of ships on the basis of the wake they produce. |
|

MyAsia Reid
Senior - CS
myasia08@aol.com
Presentation (PPT)
Poster (PPT) |
Autonomous Surface Vehicle
Mentors: Dr. Eric Akers, Ben Panzer, Kyle Byers and Jerome Mitchell
Center for Remote Sensing of Ice Sheets (CReSIS), University of Kansas
Abstract
Sensors such as the Moderate Resolution Imaging Spectroradiometer(MODIS) and Sea-viewing Wide Field of View Sensor(SeaWiFS),require limited human efforts in acquiring data on water quality. However, these have associated errors with calibration due to the assumption of uniformity in pixel data. Surface vehicles with GPS have the capability of resolving this uncertainty by collecting geographically referenced data to enable accurate tracking of changes within and between pixels. The purpose of this research was to build a prototype surface (Autonomous Surface Vehicle) that can navigate and collect continuous water samples in order to complement data from MODIS and SeaWiFS. The vehicle is routed using gyro and GPS, motor control, coordination of temperature sensor for data storage by an SD card is performed by a programmed microcontroller board. Testing was carried out on a pond close to the center(CReSIS) and data on temperature was collected from GPS locations.Future work would focus on increasing sensor integrations and enabling buoy mode to allow for multiple data sets to make results more meaningful. |
|

Michael Jefferson
Senior - CS
michaeljefferso@yahoo.com
Presentation (PPT) |
Tracking Ice Flow in two Greenland Outlet Glaciers
Mentor: Mark Fahnestock
University New Hampshire(UNH) Research and Discover Program
Abstract
Using satellite imagery the activities of two Greenland outlet glaciers was investigated. Kangiata Nunata Sermia(KNS) located at Latitude(62.4), Longitude(-49.6) and Nunatakavsaup Sermia(NKS) located Latitude(74.6) ,Longitude( -56.0) were the sources of high variations in ice velocity changes between the years of 2001 to 2010. The changes in the ice velocities were investigated using a program written in MATLAB that tracked the most prevalent features in the ice. NKS which was the northernmost glacier was the source for the highest ice velocities through the years of 2002 and 2005. This change was primarily due to a large ice front retreat which directly affected the ice velocities throughout the years investigated. Through the years of 2002 to 2005 there was an increase in velocity of this glacier by 5 meters per year which is 1,875 meters per year. KNS showed a slight variation in velocity but this change was not a significant amount throughout the years that the data was available. As more glaciers accelerate, due to an inequality in the mass balance of these glaciers, the contribution of Greenland to sea-level rise will continue to increase. |
|

Robyn Evans
Junior - MATH
rrevans@mail.ecsu.edu

Michael Austin
Junior - CS
maaustin@mail.ecsu.edu
Poster
|
Visualization of Ice Sheet Elevation Data Using Google Earth & Python Plotting Libraries
Mentors: Xiaoming Gao, Yu "Marie" Ma, Marlon Pierce, Jun Wang
REU IU Bloomington; School of Informatics :: Pervasive Technology Institute Building
Abstract
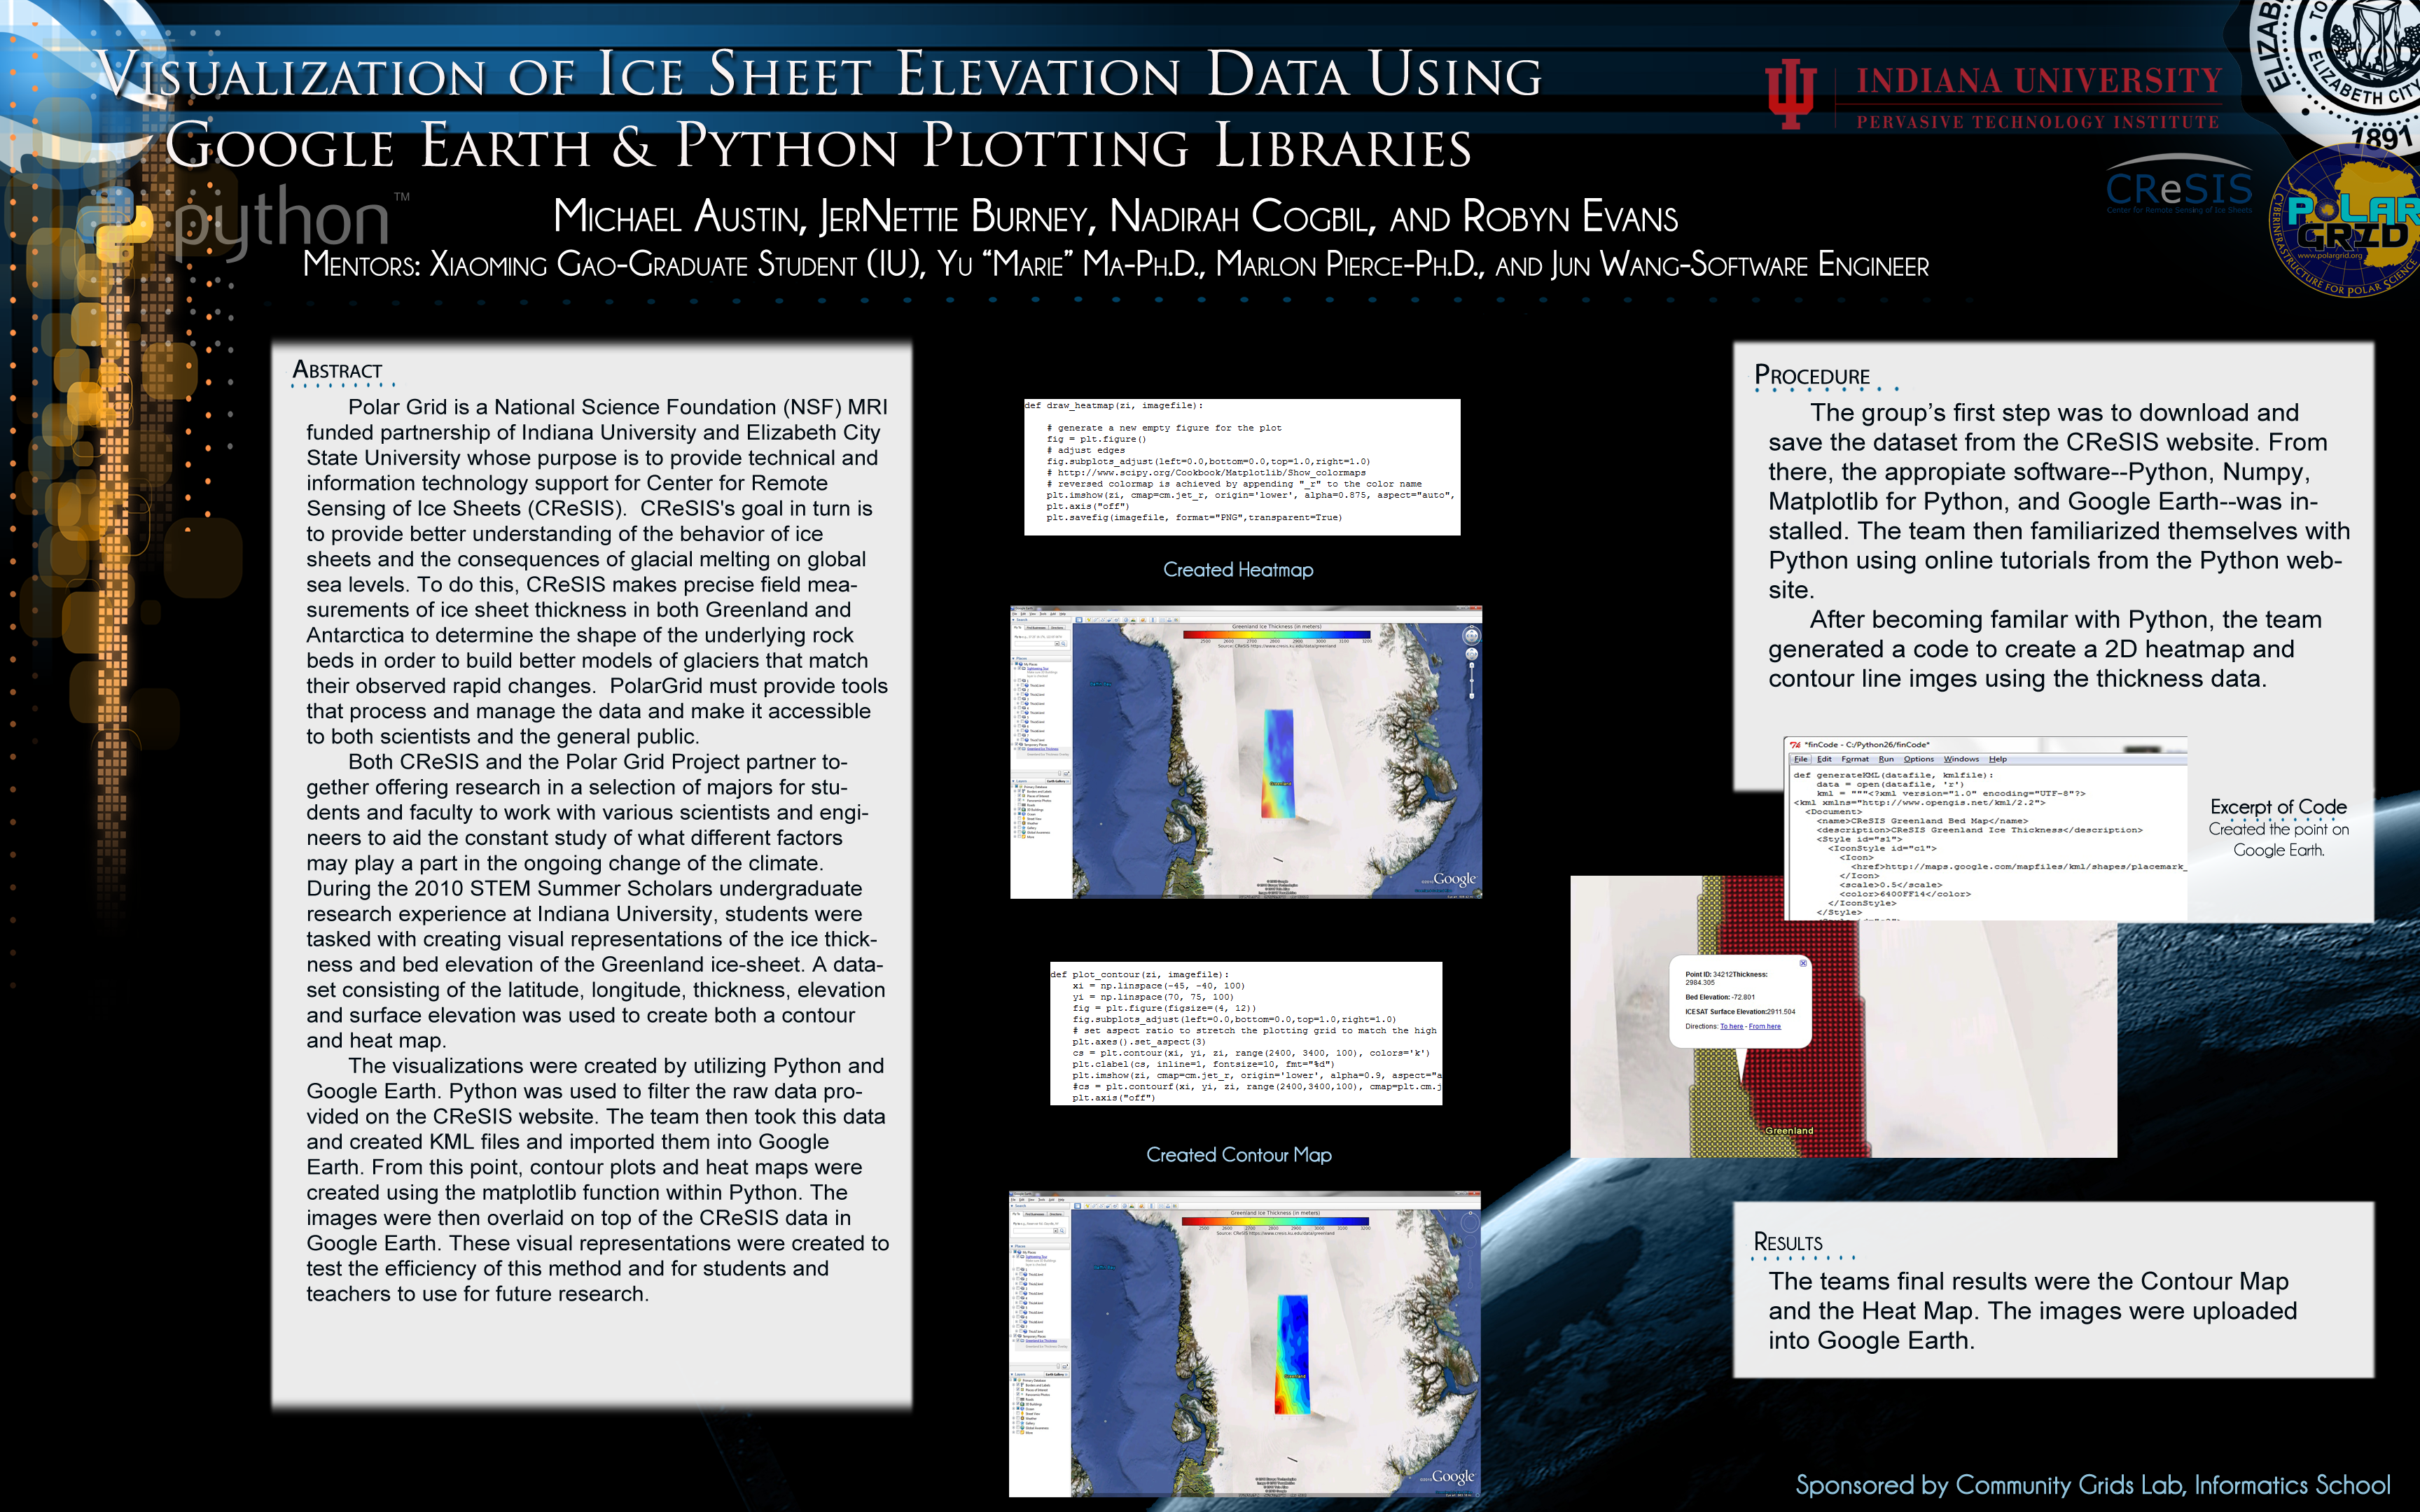
Polar Grid is a National Science Foundation (NSF) MRI funded partnership of Indiana University and Elizabeth City State University whose purpose is to provide technical and information technology support for the Center for Remote Sensing of Ice Sheets (CReSIS). CReSIS's goal in turn is to provide better understanding of the behavior of ice sheets and the consequences of glacial melting on global sea levels. To do this, CReSIS makes precise field measurements of ice sheet thickness in both Greenland and Antarctica to determine the shape of the underlying rock beds in order to build better models of glaciers that match their observed rapid changes. PolarGrid must provide tools that process and manage the data and make it accessible to both scientists and the general public.
Both CReSIS and the PolarGrid Project partner together offering research in a selection of majors for students and faculty to work with various scientist and engineers to aid the constant study of what different factors may play a part in the ongoing change of the climate. During the 2010 STEM Summer Scholars undergraduate research experience at Indiana University, students were tasked with creating visual representation of the ice thickness and bed elevation of the Greenland ice-sheet. A dataset consisting of the latitude, longitude, thickness, elevations, and surface elevation was used to create both a contour and heat map.
The visualizations were created by utilizing Python and Google earth. Python was used to filter the raw data provided on the CReSIS website. The team then took this data and created KML files and imported them into Google Earth. From this point, contour plots and heat maps were created using the matplotlob function within Python. The images were then overlaid on top of the CReSIS data in Google Earth. These visual representations were created to test the efficiency of this method and for students and teachers to use for future research. |
|
|
|
|

JerNettie Burney
Junior - CS
jaburney@mail.ecsu.edu

Nadirah Cogbill
Sophomore - Math
nacogbill743@mail.ecsu.edu
Poster
|
Evaluation of Cloud Storage for Preservation and Distribution of Polar Data
Mentors: Marlon Pierce, Yu (Marie) Ma, Xiaoming Gao, and Jun Wang
Indiana University of Bloomington
Abstract
The team goal was to find a service that could both store large amounts of data that Polar Grid has collected, and also be sure that the data will be preserved for researchers of the future to continue to use the data. For this reason, the team looked to a cloud storage service for the solution. Cloud storage is the storing of data that is accessible as a service by the use of a network. In this case, the team decided to research online storage using Amazon Web Services (AWS) and researched what AWS was, how reliable it was, how much data could be stored, and if data would be lost over an extended period of time. AWS is a cloud computing platform that is offered by Amazon.com that is made up of different computing services that are also known as web services. Within AWS, there is a service called the Simple Storage Service (S3) that is a user-friendly way of storing data over the Internet. The project shifted to investigate more about what is S3 and if it provided the services needed to aid PolarGrid. There were questions pertaining to S3 that the group researched. One of the questions was the guarantee of the reliability that S3 mentioned in their Service Level Agreement, which is the service terms promised to the user. Also, there was mentioning of a “durability” guarantee of the service by 99.9999999%. What did Amazon mean by “durability”? What does that percentile guarantee? Is that percentile guaranteed over a lifetime or only a few days? What is the likelihood of losing irreplaceable field data over various time scales (years, decades, and longer)? Financially, the group was to investigate how cost efficient it would be for Polar Grid to use this service. Polar Grid uses 26 Terabytes and over 300,000 files, and it was the duty of the group to investigate how Polar Grid would be charged. Would be for how much data will be stored, how much time the data will be stored in this service, or both. For this project, the aim of the group was to have these questions answered so that Polar Grid may have a secure place to store its mounds amount of data. |
|

Joyce Bevins
Junior - CS
blessed1989@hotmail.com
Poster |
Data Point Visualization and Clustering Analysis
Mentors: Jong Youl Choi, Ruan Yang, and Seung-Hee Bae
STEM Indiana University of Bloomington
Abstract
The primary purpose of this research project was to create a research tool for 3D data point visualization and clustering analysis, which is one of the most popular data analysis methods in bioinformatics and cheminformatics. For this purpose, we have implemented the Barnes-Hut Tree algorithm in C# to visualize cluster structures of 3-dimenisional data and added the function to a visualization tool, called PlotViz, which is written in C# and Microsoft XNA graphic libraries, developed by the CGL research lab in Indiana University. We have also performed clustering analysis of real research data used in IU bio- and chem-informatics research groups. Among many clustering algorithms available, in our analysis, we have applied two popular clustering algorithms, k-means and hierarchical clustering, by using R, which is a standard statistical analysis tool, and compared the qualities by measuring “withinness” which is the sum of Euclidean distances between cluster centers and points for each cluster group. The results are also compared by visualizing the data points in 3D by using PlotViz. |
|
|

Jean Bevins
Junior - CS
twin-j@hotmail.com
Poster
|
Creating a Security Model for SALSA HPC Portal
Mentors: Adam Hughes, Saliya Ekanayake
STEM Indiana University of Bloomington
Abstract
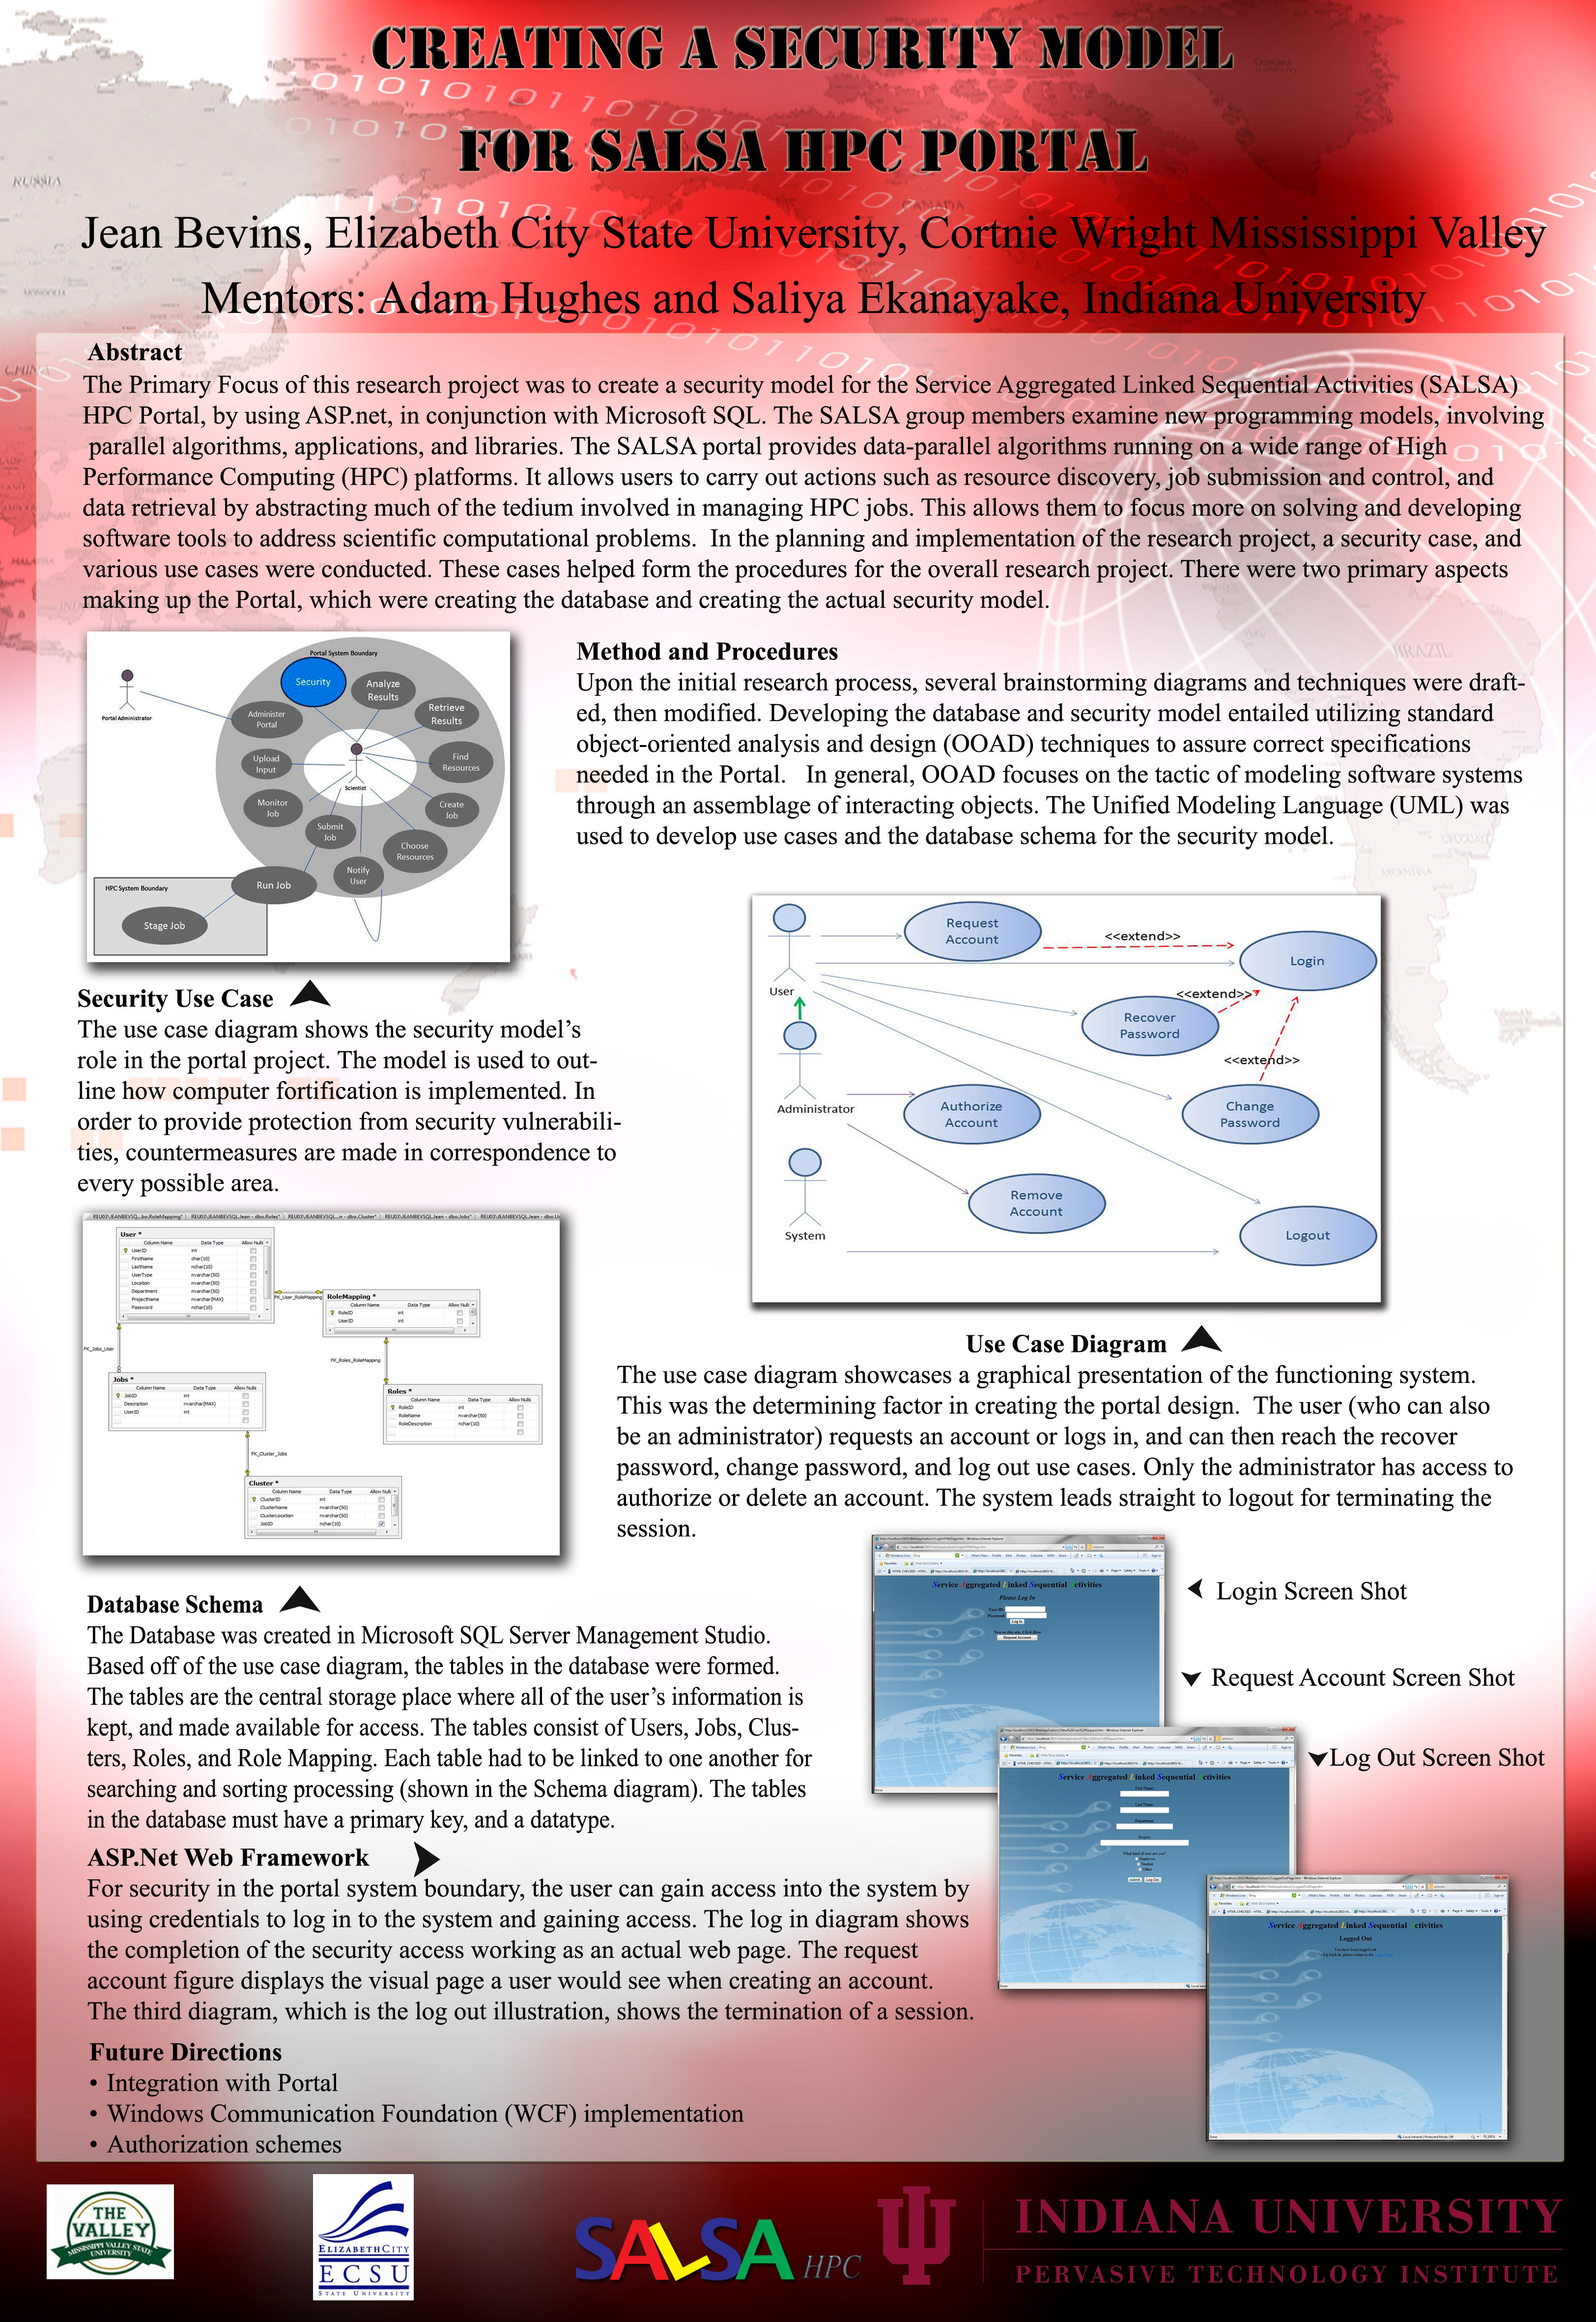
The Primary Focus of this research project was to create a security model for the Service Aggregated Linked Sequential Activities (SALSA) HPC Portal, by using ASP.net, in conjunction with Microsoft SQL. The SALSA group members examine new programming models, involving parallel algorithms, applications, and libraries. The SALSA portal provides data-parallel algorithms running on a wide range of High Performance Computing (HPC) platforms. It allows users to carry out actions such as resource discovery, job submission and control, and data retrieval by abstracting much of the tedium involved in managing HPC jobs. This allows them to focus more on solving and developing software tools to address scientific computational problems. In the planning and implementation of the research project, a security case, and various use cases were conducted. These cases helped form the procedures for the overall research project. There were two primary aspects making up the Portal, which were creating the database and creating the actual security model. |
|

|
Correspondence Between Net Oxygen Production and Measurements of Inherent Optical Properties
Mentor: Dr. Joseph Salisbury
University of New Hampshire
Abstract
Data was collected onboard a Lagrangian cruise in order to find correlations and relationships between a biological oxygen stock and inherent optical properties in the Gulf of Maine. A buoy drifting at 12 meters was tracked during a two and a half week process. Using a CTD (Conductivity, Temperature and Depth) profiler along with an IOP (Inherent Optical Property) profiler, were able to take profiles of the Gulf of Maine according to the location of the buoy.
Upon completion of the cruise, we went into the data processing stage. We used MatLab as a platform to read the data from our profiling machines, and manipulate it to search for relationships. We wanted to integrate our variables down the euphotic zone, which is where light is equal to 1% of the surface light. The importance of the euphotic zone is that this is where oxygen production and consumption happens due to biology (Photosynthesis and Respiration). Using a MatLab formula we were able to derive integrated stocks of each of the variables and developed plots.
Our graphs consisted of concentrations, inventories, and rates of change. The IOP profiling machine produced hundreds of variables, however we only viewed a few such as absorption, attenuation and particle backscattering at different wavelengths, chlorophyll fluorescence, and a couple more. Of the variables viewed, particle backscattering at 555 nanometers gave us the best relationship to oxygen. We developed temporal differencing plots in order to see whether or not this relationship remained consistent throughout the day, and we found that as the oxygen stock changed, so did the particle backscattering stock. |
|

|
Bottom Fishing Activity in the Gulf of Mexico
Mentor:
NOAA
Abstract
The Deep Water Horizon oil spill is an ecological disaster that has threatened the coast and the livelihood of millions. In response to these recent events, there is a continuous effort for coastal restoration and conservation of coastal and ocean resources through an ecologically sound approach. At the Southeast Fisheries Science Center, the primary focus was to research how the oil spill has impacted the fishing activity specifically in the Gulf of Mexico. Data collection and warehousing methods were used with GIS tools to map spatial data of fishing trends and regressions. In addition, the data collected was manipulated in real-time using the Google Maps API. The largest task at hand was the development and deployment of an object oriented web application that would encapsulate all of the data analysis previously mentioned. |
|
| |
|
|
|
|
|
|
 |
Elizabeth City State University does not endorse, sponsor or provide material located on this site. |
| |
|

