
| HOME | LINKS |
|---|
Undergraduate Research Experience [URE] - Summer Scholars Institute - Summer 2010 [Poster]
REU IU Bloomington; School of Informatics :: Pervasive Technology Institute Building
Visualization of Ice Sheet Elevation Data Using Google Earth & Python Plotting Libraries
Mentors: Xiaoming Gao, Yu "Marie" Ma, Marlon Pierce, Jun Wang
Abstract
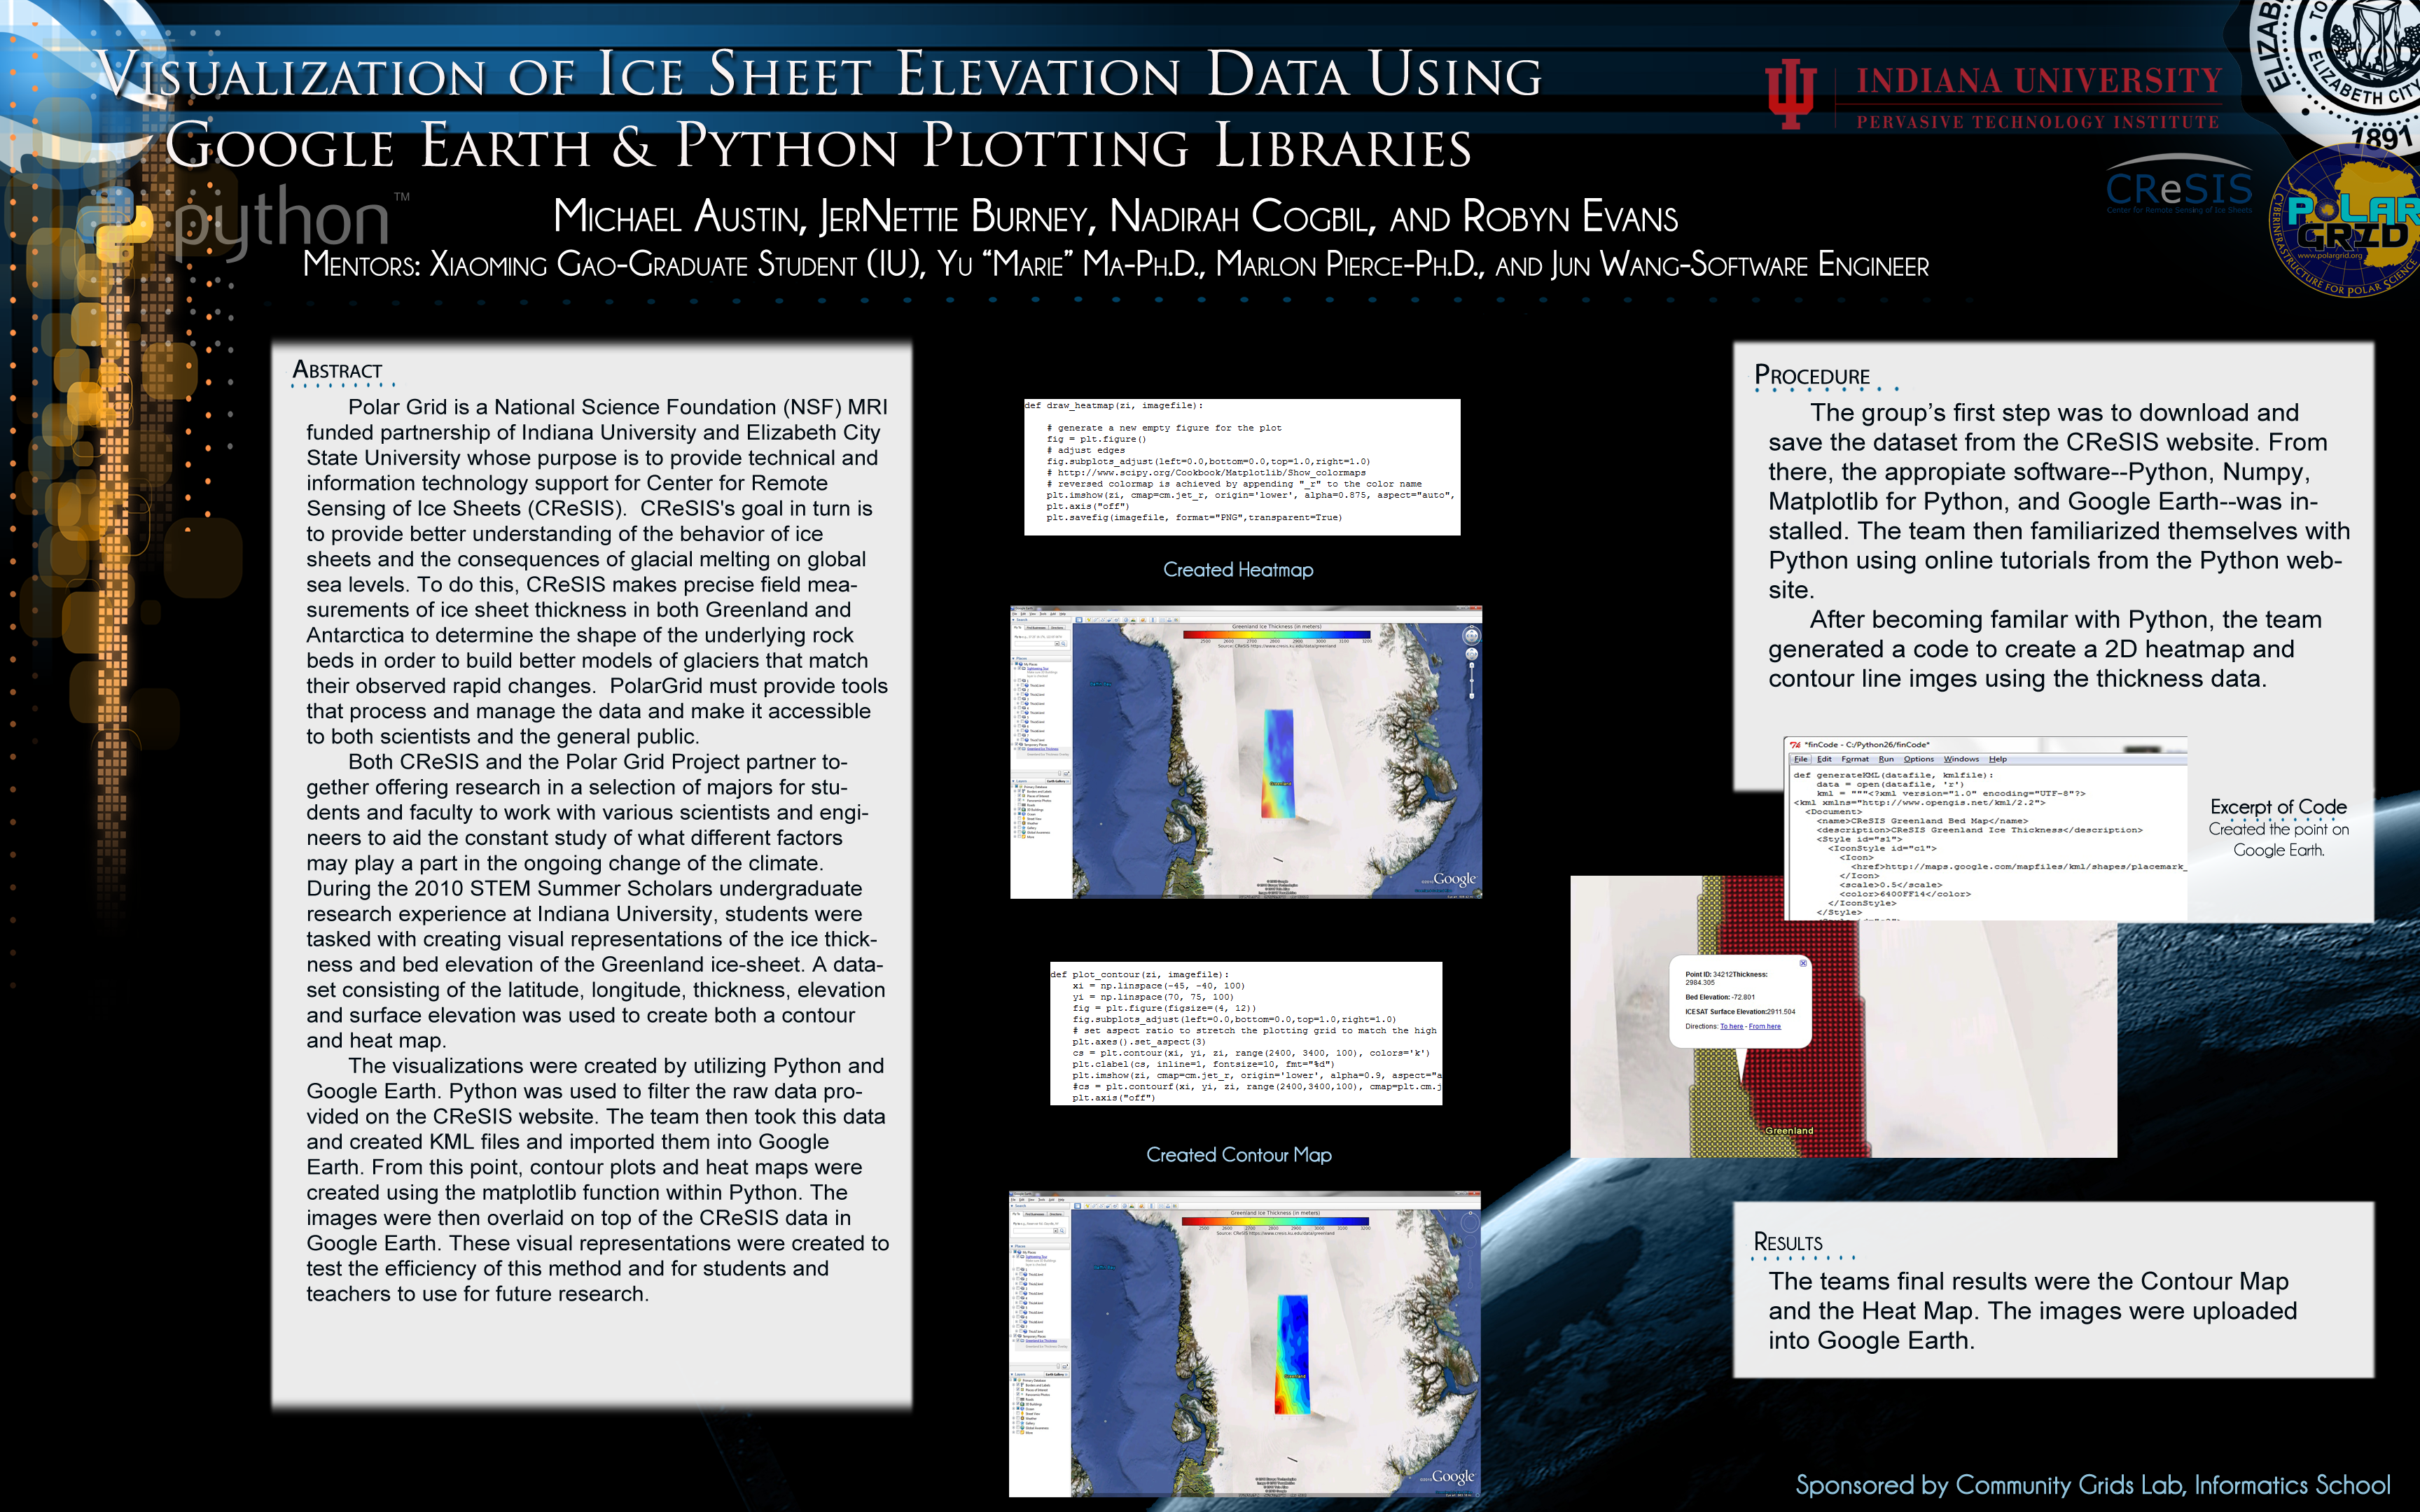
Polar Grid is a National Science Foundation (NSF) MRI funded partnership of Indiana University and Elizabeth City State University whose purpose is to provide technical and information technology support for Center for Remote Sensing of Ice Sheets (CReSIS). CReSIS's goal in turn is to provide better understanding of the behavior of ice sheets and the consequences of glacial melting on global sea levels. To do this, CReSIS makes precise field measurements of ice sheet thickness in both Greenland and Antarctica to determine the shape of the underlying rock beds in order to build better models of glaciers that match their observed rapid changes. PolarGrid must provide tools that process and manage the data and make it accessible to both scientists and the general public.
Both CReSIS and the Polar Grid Project partner together offering research in a selection of majors for students and faculty to work with various scientists and engineers to aid the constant study of what different factors may play a part in the ongoing change of the climate.
During the 2010 STEM Summer Scholars undergraduate research experience at Indiana University, students were tasked with creating visual representations of the ice thickness and bed elevation of the Greenland ice-sheet. A dataset consisting of the latitude, longitude, thickness, elevation and surface elevation was used to create both a contour and heat map.
The visualizations were created by utilizing Python and Google Earth. Python was used to filter the raw data provided on the CReSIS website. The team then took this data and created KML files and imported them into Google Earth. From this point, contour plots and heat maps were created using the matplotlib function within Python. The images were then overlaid on top of the CReSIS data in Google Earth. These visual representations were created to test the efficiency of this method and for students and teachers to use for future research.
2009 - 2010 Undergraduate Research Experience (URE) [website]
Elizabeth City State University :: Elizabeth City, NC
A Comparison of Job Duration Utilizing High Performance Computing on a Distributed Grid
Mentor: Mr. Je'aime Powell
Abstract
The Polar Grid team was tasked with testing the central manager system on Elizabeth City State University to ensure that it was prepared for grid computing This was achieved by installing the Condor 7.4.0 client on iMac workstations computers located in Dixon Hall, Lane Hall, and E.V. Wilkins on the campus of Elizabeth City State University. Condor allowed jobs to be submitted to the central manager and distributed to one or more nodes. The job that the team submitted to Condor was the compiled Sieve of Eratoshenes in C++ code. This code generated prime numbers from 0 to 500,000, and was essential in testing the job submission process. The compiled code that was used in the script file was submitted to the central manager through Condor. These jobs were then distributed to available nodes for processing.
After each successful job submission, log files were created to record statistical data. The data was of the elapsed time it took to process each individual job. The data from these tables were imported into Minitab, which was a statistical analysis software package. Ana analysis of variance was then performed to determine if the elapsed times of the submissions carried within a 5 percent level of significance. From that a determination of if increasing the number if nodes decreased the elapsed time; thereby showing a performance increase.
Summer 2009 Undergraduate Research Experience (URE) Program [website]
Visualization of the 1993-2007 CReSIS Greenland Data Sets for the Polar Grid High Performance Computing System
Team Members: Michael Austin, Frensha Slaughter, Shaketia McCoy
Team Mentor: Jeff Wood
Key Words: Data Visualization,Google Maps, Excel, PHP, JavaScript, CReSIS, Polar Grid
Abstract
The Center for Remote Sensing of Ice Sheets (CReSIS) has been compiling Greenland ice sheet thickness data since 1993. The airborne program utilizes a 150 MHz radar echo sounder to measure the ice thickness. The data is currently available on the CReSIS web site in various formats including PDF, Matlab, and plain text files. These formats are not usable in the classroom environment as a visual representation of the ice depth for each expedition.
During the Undergraduate Research Experience in Ocean, Marine and Polar Science 2009 program, the Greenland Data Visualization Team took the CReSIS data and created a 4-D visualization consisting of depth, time, latitude, and longitude. This visualization was created utilizing HTML, JavaScript, and PHP. Microsoft Excel was used to filter the raw data downloaded from the CReSIS site. The team then statistically analyzed the Greenland ice sheet thickness data for calculated, missing, and actual depth readings. The goal of this project was to present the CReSIS data via the web in a visual format to elementary, undergraduate, and graduate students for research and education. This visualization package and corresponding data will eventually be migrated to the Elizabeth City State University Polar Grid High Performance Computing System. The research that follows involved converting plain text files to comma separated values to be used by PHP and JavaScript to produce data visualizations in Google Maps and HTML pages.
2008 - 2009 Undergraduate Research Experience (URE) Program [website]
Elizabeth City State University :: Elizabeth City, NC
Evaluation and Implementation of Web 2.0 Technologies in Support of Research Projects at ECSU
Mentor: Mr. Jeff Wood
Abstract
The primary focus of this research project was to study the implementation of Web 2.0 technologies to support scientific research and provide educational resources. Web 2.0 technologies include social networking, text and data mining, knowledge incorporation environments, tagging, visualization, and mashups. These technologies are widely used in popular sites such as MySpace, Facebook, and iGoogle. Various research and government organizations such as NASA, Harvard's Science and Engineering department, and the Technology Student Association have also implemented these technologies.
The 2008 - 2009 Multimedia Team focused on specific server software packages to execute Content Management Systems (CMS) for future inclusion in several ongoing projects under the Center of Excellence in Remote Sensing Education and Research (CERSER) umbrella. Four open source software packages were evaluated, installed, and documented as models for future installations. These software packages were Joomla, WordPress, Drupal, and MediaWiki.