Research
Polar Grid Abstract-Team Page
Team Members:KAIEM L. FRINK, MICHAEL JEFFERSON JR.,VERNON T. BROWN JR., Team Mentor: JE'AIME POWELL,
One of the major goals of the Polar Grid project was to interconnect partner institutions through a virtual conferencing solution. Included in that grant were funds to upgrade the capabilities of Elizabeth City State University and partner ADMI institutions. In the case of Elizabeth City a Polycom 8000 system and VBrick video forwarding system were purchased. ADMI partner institutions received Polycom PVX kits, which could be utilized on Windows-based desktop computers.
The purpose of the Polar Grid team was to design polices that guide the usage of the polycom system to allow effective use. The policies focused on four core areas. The areas were, hosting a virtual conference, connecting to a conference, connecting ADMI partner institutions using PVX kits, and working with faculty to create a procedure to request teleconferences.
Carnegie Mellon University Information Systems Internship
Served as Assistant Project Manager of the A-Team. Where we developed an
Website Information Systems for a Non profit Organization in the community WPDI.
Mentors: Dr. Jennifer Foster, Dr. Randy Weinberg, Dr. Larry Heimann
Jeronna G. Pope-Savannah State University
Richard Osei-Langston University
Bruce E. Davis-Lincoln University
Tiffany D. Francis-Lincoln University
Melissa O. Elliott-Hampton University
Lisa M. Hall-Oakwood College
Ryan C. Lowe-Oakwood College
Kaiem L. Frink-Elizabeth City State University
Phase Report One-(Word)
Phase Report Two-(Word)
Phase Report Three -(Word)
Power Point
Power Point -(PDF)
____________________________________________
A Comparative Study of Energy Forms Used by the G-8 Between the Years 1980-2006
Mentor Dr. Andrea Lawerence
Martin O. Arienmughare1, Brandi R. Brehon2, Kaiem L. Frink3, April J. Harry4, Kenneth A. Joyner5
1Lincoln University, Lincoln University, Pennsylvania
2 Elizabeth City State University, Elizabeth City, North Carolina
3 Elizabeth City State University, Elizabeth City, North Carolina
4Xavier University of Louisiana, New Orleans, Louisiana
5Elizabeth City State University, Elizabeth City, North Carolina
Research Paper-(Word)
Power Point
Abstract
– The objective for the 2007 Elizabeth City State University-National
Association of Mathematicians Computational Science and Scientific
Visualization Summer Institute research project is to compare the
various major types of energy sources used by the G-8 countries—Canada,
France, Germany, Italy, Japan, Russia, United Kingdom, and United
States—with the assistance of data for the years 1980-2006 from
reliable online resources. Comparisons will determine specifically what
types of energy sources are used by these countries and any concerns
that they may produce (environmental or otherwise). This project will
evaluate uses of energy for each G-8 country by using regression
analysis to predict the energy consumption for each country in 2010.
Lines of Regression will be displayed by graphs created in Minitab and
MathCAD. Ultimately, we intend to conclude that the consumption of
energy for each country will increase by the year 2010.
____________________________________________
Graph Theory Applications in Relation to the Study of the Ecosystem and DNA Sequencing
Course: Discrete Methods Spring 2007
Group Project 2007
Erika Mizelle, Kaiem L. Frink
Research Paper-(Word)
Power Point
Abstract
- The word graph (graf) comes from the Greek word graphein and is a
noun. It is a diagram indicating any sort of relationship between two
or more things by means of a system of dots, curves, bars, or lines.
The word ecosystem (e’ko sis’tem) is from the Greek word oikos meaning
habitat + system. It is defined as a community of organisms and their
nonliving environment.
____________________________________________
Undergraduate Research 2006-2007
A Study to Determine Groundwater Quality in Pasquotank County using GIS
Mentors:
Joseph Ausby
Keisha Wilkins
Research Team Members
Lee Smalls Jr, Akeem Archer, Kaiem L. Frink
Research Paper-(PDF)
Research Poster(JPG)
Power Point
Ground
water is the water beneath the surface of the ground. It consist
largely of surface water that has seeped down and is the source of
water in springs and wells. Groundwater makes up about twenty percent
of the world’s fresh water supply, which is about 0.61 percent of the
entire world’s water supply (Environment Canada Website). Because it is
a source for well water it is important to monitor the waters quality
to insure that it is safe for consumption.
Several
factors can cause groundwater pollution including septic systems, small
disposal pits, house and garden chemicals, stream infiltration,
landfills, underground storage tanks, and pipelines.
The
2006-07 research team will investigate the effects that a sanitary
septic systems has on groundwater, in addition to other potential
sources of groundwater contamination in Pasquotank County. A database
will be created using ArcGIS and Visual Basic Applications to input
existing and captured groundwater data. This database will be used to
conduct analyzes on contamination levels, nutrient levels, and to
compare residents within a certain area who have septic systems instead
of wells. This study will help to identify the quality of groundwater
in Pasquotank County.
To accomplish this project ArcGIS and Visual
Basic Application will be utilized. Existing data will be collected
from the public health department and other public agencies. Data will
also be collected through ground truthing by sampling groundwater from
a monitoring well.
------------------------------------------------------------------
URE OMS 2006
Undergraduate Research Experience in Oceanic and Marine Science
Antarctic Temperature Mapping
Team member Lee Smalls Jr.- Mentor Dr. Malcolm LeCompte
Research Paper-(PDF)
Research Poster(JPG)
Power Point
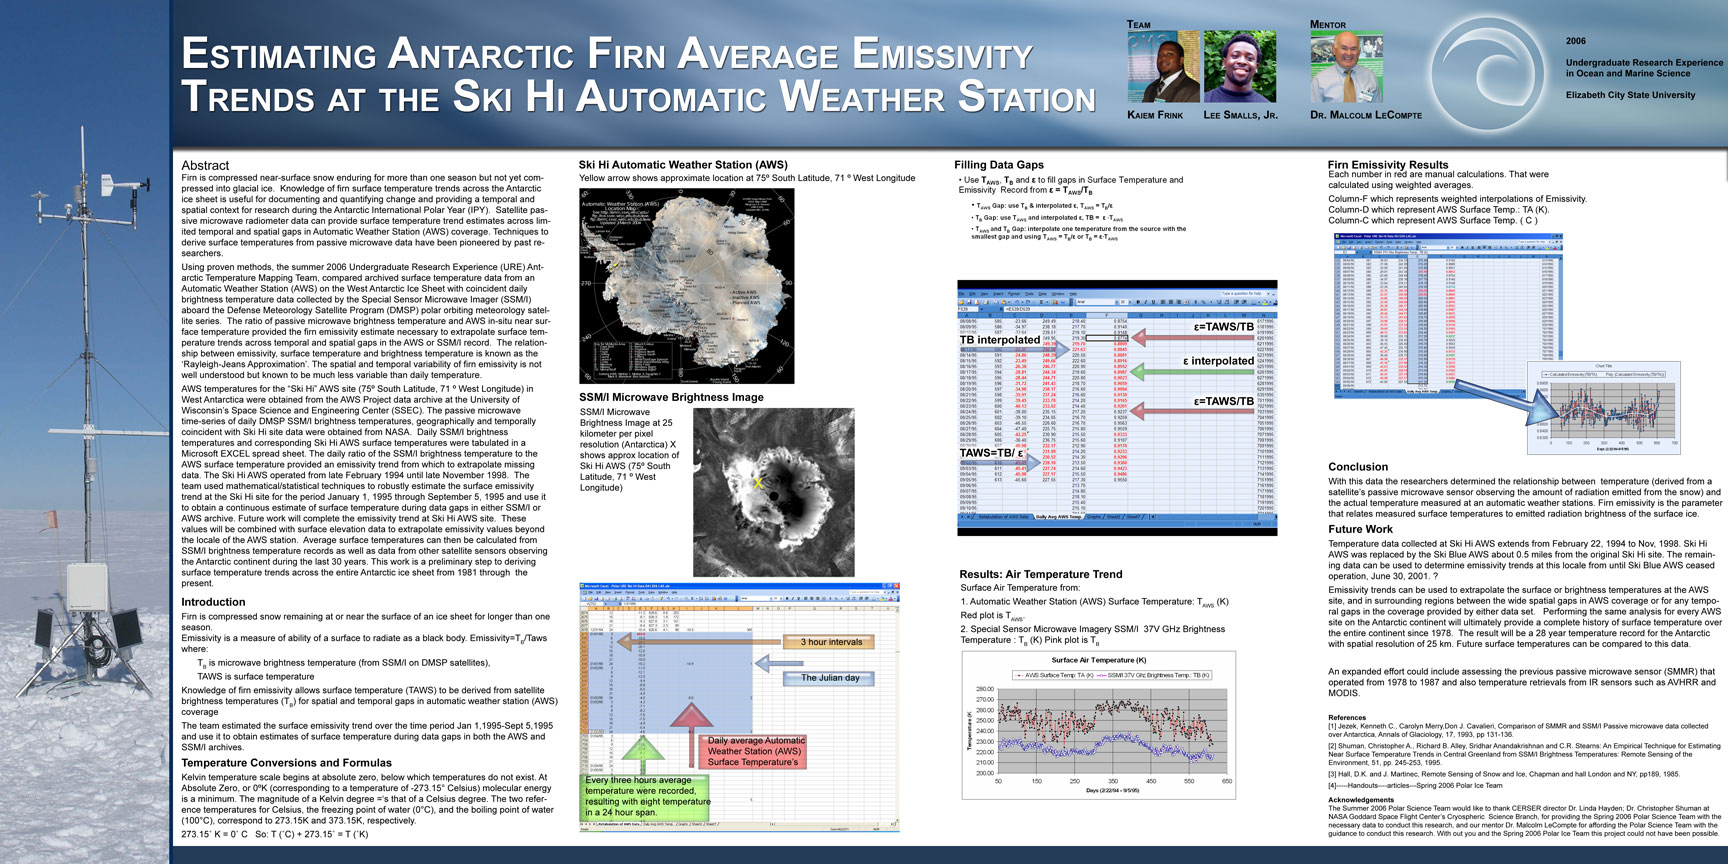
Estimating Antarctic Firn Average Emissivity Trends at the Ski Hi Automatic Weather Station
Firn is compacted, near-surface snow enduring for more than one season
not yet compressed into glacial ice. Knowledge of firn surface
temperature trends across the Antarctic ice sheet is useful for
documenting and quantifying change and providing a temporal and spatial
context for research during the Antarctic International Polar Year
(IPY). Satellite passive microwave radiometer data can provide surface
temperature trend estimates across limited temporal and spatial gaps in
Automatic Weather Station (AWS) coverage. Techniques to derive surface
temperatures from passive microwave data have been pioneered by Jezek
et al., (1993) and. Shuman et al., (1995).
Using the methods of previous researchers, the Summer 2006
Undergraduate Research Experience (URE) Antarctic Temperature Mapping
Team, is comparing archived surface temperature data from an AWS on the
West Antarctic Ice Sheet with coincident daily brightness temperature
data collected by the Special Sensor Microwave Imager (SSM/I) aboard
the Defense Meteorology Satellite Program (DMSP) polar orbiting
meteorology satellite series. The ratio of passive microwave brightness
temperature and AWS in-situ near surface temperature provides the firn
emissivity estimate necessary to extrapolate surface temperature trends
across temporal and spatial gaps in either the AWS or SSM/I record. The
relationship between emissivity and surface temperature is generally
known as the ‘Rayleigh-Jeans Approximation’ (Hall and Martinec, 1985).
The spatial and temporal variability of firn emissivity is not well
understood but known to be much less variable than daily temperature.
------------------------------------------------------------------
Elizabeth City State University GIS Map
GEOL 460-Summer 2006
Mentor: Elizabeth Noble
Title: Elizabeth City State University GIS Map
Objective:
To generate an interactive map of Elizabeth State University Using GIS
technologies. Using the GIS technologies the follow goals are set forth
for the Elizabeth City State University GIS Map.
- Determining the shortest path to the buildings on campus.
- Shortest path for Motor Vehicles-Drop off Services
- Incorporating Elizabeth City Bus Routes-Prior Project conducted by (Heather)
Technologies: Basin Pro
ArcView GIS Version 3.1
Image Remote Sensing
Product: GIS Map & Database to be used university.------------------------------------------------------------------------
2005-2006
Multimedia
Research Team Automated Approach of Cataloguing TeraScan Images
utilizing Exchangeable Image File Format (EXIF) Data
Team member: Shaquera Mosley,Danielle Wright, Garry Cameron, Lee Smalls, Jr - Mentor: Jeff Wood
Research Paper-PDF
Research Poster(JPG)
Power Point
ABSTRACT
Automated Approach of Cataloguing TeraScan Images utilizing Exchangeable Image File Format (EXIF) Data
The
Center of Excellence in Remote Sensing Education and Research (CERSER)
on the campus of Elizabeth City State University is currently tasked
with the responsibility of receiving remotely sensed Advanced Very High
Resolution Radiometer (AVHRR) and Sea Wide Field-of-View Sensor
(SeaWiFS) data for research projects year round. This data is
collected, processed, annotated, and transformed into images in the
Tagged Image File Format (tiff). These tiff images are then uploaded to
the CERSER archive library server located at http://cerser.ecsu.edu.
Once uploaded, they are converted into various resolutions and their
information is added to a tracking database maintained with Microsoft
Access software. This database provides a searchable means for
retrieving satellite image data through various parameters.
The
conversion of the tiff file to its various resolutions and the entry of
data into the tracking database are currently done manually by the
CERSER webmaster. The amount of time to enter one image into the system
is approximately ten minutes. The process is also limited by the
requirement that the webmaster be located at one computer terminal
located on the campus to perform these tasks.
The goal of
the 2005 ONR Multimedia Team (MMT) is to automate this process
utilizing data captured from the tiff files Exchangeable Image File
Format (EXIF) data. This data contains the capture time and date along
with file resolution and file size. Utilizing this information will
allow various scripts to be written eliminating the necessity for the
manual conversions and data input to be made resulting in a more up to
date and accurate archiving system of the images. Various methods and
languages were utilized including Java, JavaScript, and Adobe Photoshop
Action Scripts to complete this process.
----------------------------------------------------------------------------------------------------------------------------------------------
Undergraduate Research Experience in Oceanic, Marine and Space Sciences
Summer 2005 Beaufort Stock Assessment
Research Paper-PDF
Research Poster (JPG)
Power Point
Research Paper-Word
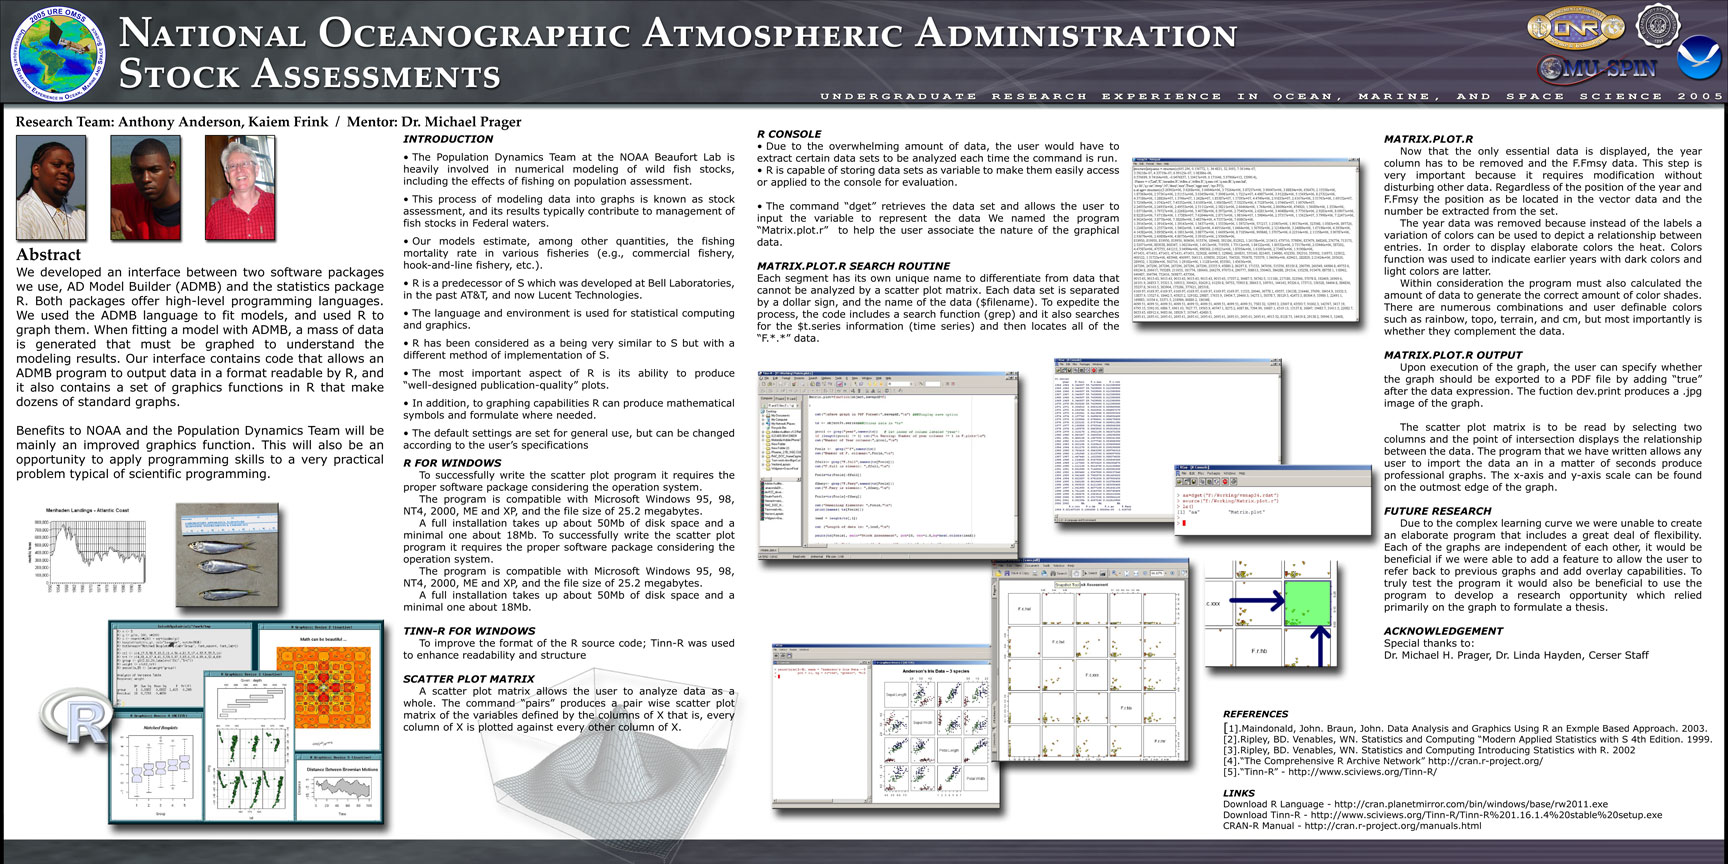
Team Member: Anthony Anderson-- Mentor: Dr. M. Prager-Resume
Abstract
This internship involved the development of a graphical user interface
between two software packages, AD Model Builder (ADMB) and the
statistics package R. The ADMB software was used to fit models and then
R was used to graph them. ADMB generates a large amount of data that
must be graphed in order to obtain representative results. The
interface developed allows an ADMB program to output data in a format
readable by R. The interface also contains a set of graphic functions
in R that formulate many common graphs.
The benefits to NOAA and the Population Dynamics Team is an improved
graphics function. This internship increased familiarity in general
with scientific programming and particularly with the R language.
----------------------------------------------------------------------------------------------------------------------------------------------
Acadmic year 2004-2005 Multimedia Research Team
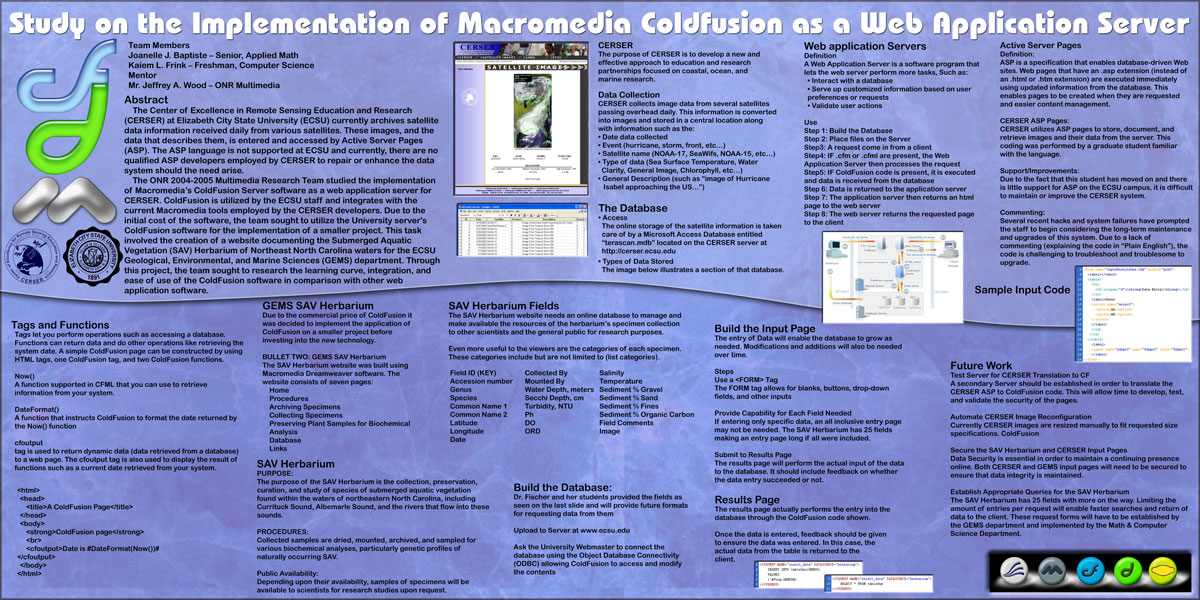
Study on Implementation of Macromedia ColdFusion as a Web Application
ServerStudy on Implementation of Macromedia ColdFusion as a Web
Application Server
Team member: Joanelle Baptiste-- Mentor: Jeff Wood
Research Paper-PDF
Research Poster-JPG
Power Point
Abstract
The ONR 2004-2005 Multimedia Research Team studied the implementation
of Macromedia’s ColdFusion Server software as a web application server
for small scale online databases. ColdFusion is utilized by the ECSU
staff and integrates with the current Macromedia tools employed by the
ONR media developers. The team’s goal was to utilize the University
server's ColdFusion software for the implementation of a small, startup
site. This site involved documenting the Submerged Aquatic Vegetation
(SAV) Herbarium of Northeast North Carolina waters for the ECSU
Geological, Environmental, and Marine Sciences (GEMS) department. The
team developed the initial site with database files in place to begin
the recording of information. The future phases of will include the
insertion, manipulation, and retrieval of actual gathered data. This
project sought to research the learning curve, integration, and ease of
use of the ColdFusion software in comparison with other web application
software.

