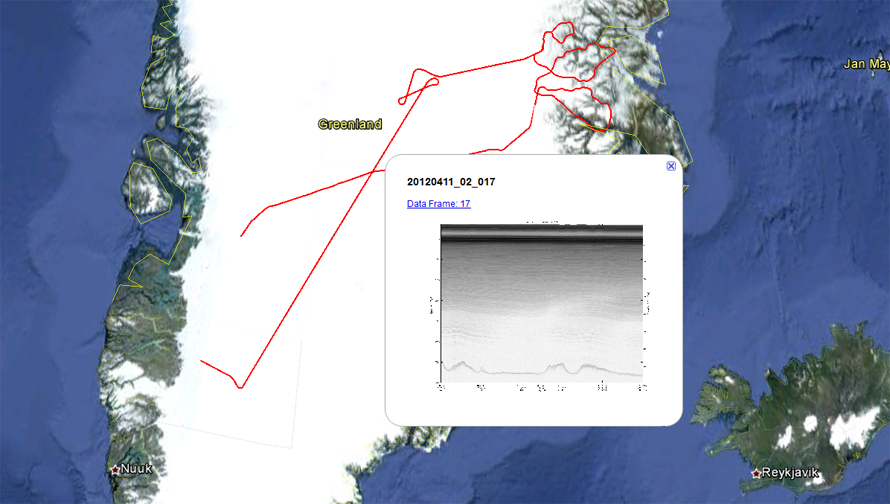
CReSIS oldest data for ice thickness in Greenland goes back to 1993. This information is in various formats such as: PDF, JPEG, KML, and CSV, which can only be displayed individually. MATLAB will display multiple sources of data in a software application only. The goal of this project was to combine the non-MATLAB visualizations into one window utilizing the PHP Hypertext Preprocessor scripting language and Google Earth. We were able to combine two files KML and JPEG into one KML. We used 52 lines of script where two variables need to be change to create a new flight: one is the URL to the KML at CReSIS and the othre is the URL to the CSV at CReSIS. We were able to use XML DOM to write and modify the KML file. The combined files were displayed in the geographical program Google Earth available as a free download to users. The screen capture below displays the final product of the Database Team research project. The user can click on any segment of the flight path and the echogram image will be displayed.
|