| Seniors |
|
 |
National
Oceanographic Atmospheric
Administration Stock
Assessments
Mentor:
Michael Prager,
Ph.D.
Population Dynamics
Team, NMFS SE Fisheries
Science Center,
NOAA Center for Coastal
Fisheries and Habitat
Research
Authors:
Anthony Anderson
and Kaiem Frink
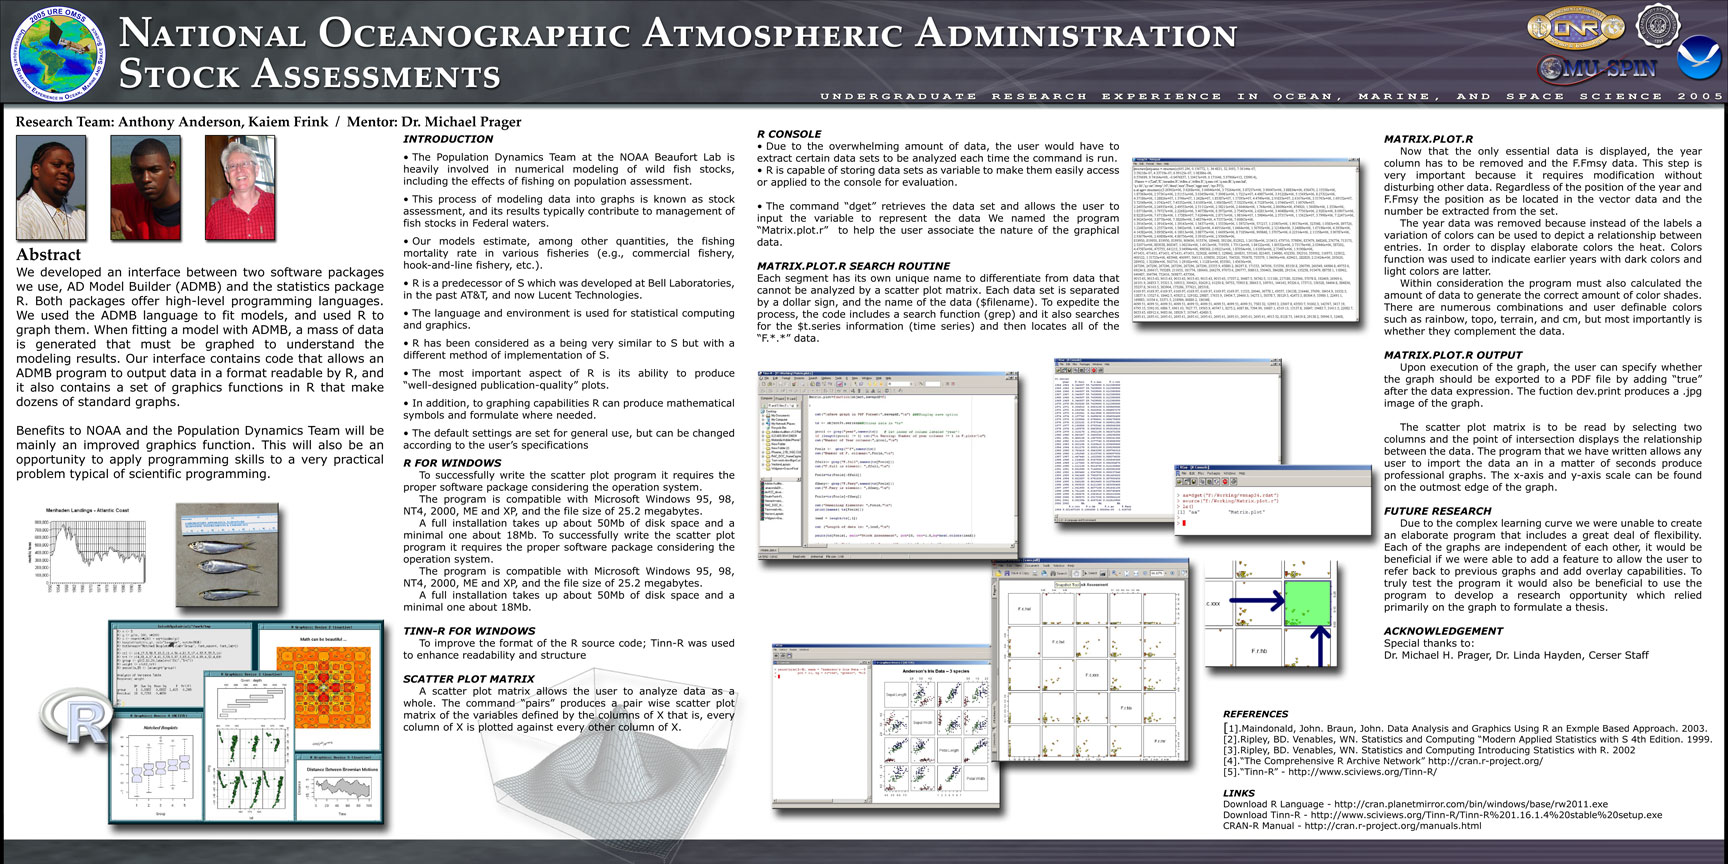
Abstract
We
developed an interface
between two software
packages we use,
AD
Model Builder (ADMB)
and the statistics
package R. Both
packages offer
high-level
programming languages.
We used ADMB language
to fit models,
and then used R
to
graph them. When
fitting a model
with
ADMB, a mass of
data is generated
that
must be graphed
to understand the
modeling
results. Our interface
contains code that
allows an ADMB
program to output
data in
a format readable
by R, and it also
contains
a set of graphics
functions in R
that make
dozens of standard
graphs.
The benefits
to NOAA and the
Population Dynamics
Team will be
mainly
an improved graphics
function. We
have increased
familiarity with
scientific
programming in
general, and
programming in
the R language
in particular |
|
| |
 |
Spatial-Explicit
Growth Rate Model
of
Young Striped Bass
in Albemarle Sound:
Implications on Essential
Fish Habitat
(EFH) Using GIS
Mentor: Anthony S.
Overton, Department
of Biology, East
Carolina University
Brittany Green
- SCSU,
Quinton Moore
- SCSU, Jameson
Gibbs - ECSU
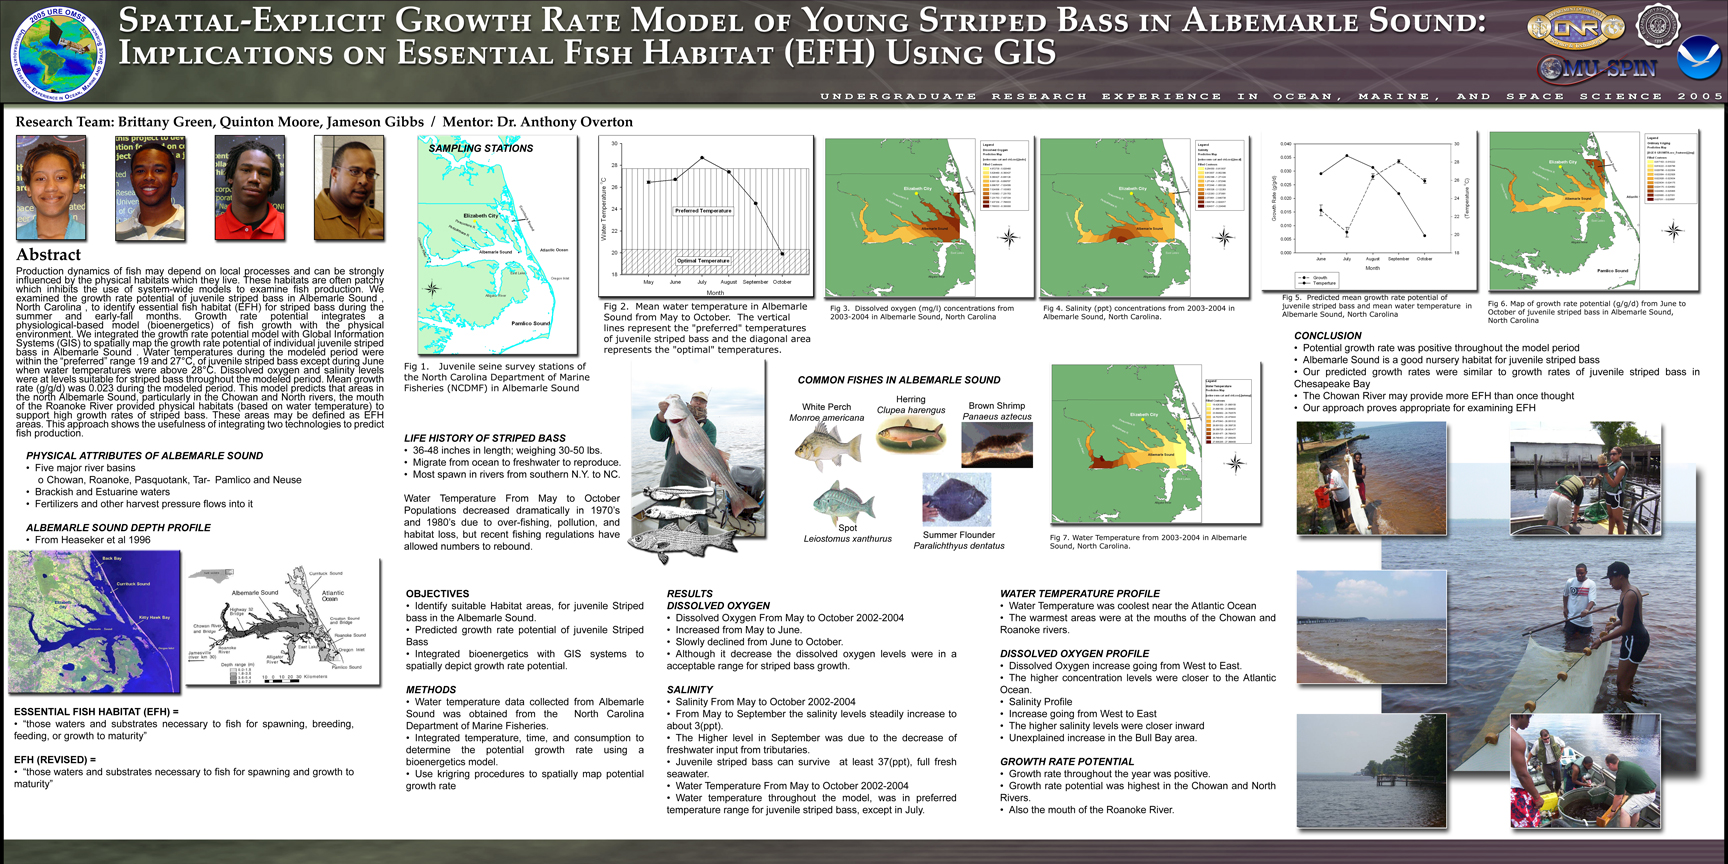
Abstract
Production
dynamics of fish
may depend on
local processes
and can be strongly
influenced by the
physical habitats
which they live.
These habitats
are often patchy
which inhibits
the use of system-wide
models to examine
fish
production. We
examined the
growth rate potential
of
juvenile striped
bass Morone saxatilis
in Albemarle
Sound, North Carolina,
to identify essential
fish habitat
(EFH) for
striped bass
during the summer
and early-fall
months. Growth
rate potential
integrates a physiological-based
model (bioenergetics)
of fish growth
with the physical
environment.
We integrated
the growth rate
potential model
with Global Information
Systems (GIS) to
spatially map the
growth gate potential
of individual
juvenile striped
bass in Albemarle
Sound. Water
temperatures during
the modeled period
were within the “preferred” range
19 and 27oC,
of juvenile striped
bass except during
June when water
temperatures
were above
28oC. Dissolved
oxygen and salinity
levels were at
levels
suitable for
striped bass throughout
the modeled period.
Mean growth rate
(g/g/d) was 0.023
during the modeled
period. Our model
predicted that
the modeled areas
all
produced positive
growth in the
north Albemarle
Sound, particularly
in the Chowan
and North rivers,
the mouth of
the Roanoke River
provided physical
habitats (based
on water temperature)
to support high
growth rates
of striped bass.
These areas may
be defined as
EFH areas. Our
approach shows
the usefulness
of integrating
two technologies
to predict
fish production.
|
Jamison
Gibbs
CS-SR
jdgibbs@mail.ecsu.edu
Research Page
Research Paper (PDF)
Research
Poster (JPG) |
| |
 |
Autonomous
Ground Vehicle
(AGV) Project
Mentor:
Dr. Glen Williams,
Texas A&M University
Abstract
The
goal of this
project was
to construct an
autonomous mobile
vehicle for research
in autonomous
controls. The
guidelines for
the DARPA Grand
Challenge contest,
sponsored by
DARPA (Defense
Advance Research
Project Agents)
were used
as the specification
goal for the
vehicle performance.
The contest requires
an autonomous
vehicle to travel
one hundred and
seventy primarily
off-road miles
from Los Angeles
to Las Vegas
in ten hours.
The autonomous
truck will operate
using a software
controller and
is equipped with
sensors such
as: a SICK Laser
Measurement System
(LMS) and a Global
Positioning System
(GPS).
I
was responsible for
writing software
that simulated vehicle
dynamics, GPS signal,
heading, and environmental
response data that
was used to test
the software controller.
The simulated data
was used in conjunction
with the software
controller to ensure
a successful traversal
along the designated
route. The simulator
imitates digital
data from the SICK
LMS and GPS and sends
this data to the
controller. The controller
then decide whether
to use the brake,
throttle or whether
to change the heading
of the vehicle and
sends control information
back to the simulator.
The simulator generates
SICK data eight times
a second and GPS
latitude and longitude
twenty times per
second. |
|
| |
 |
Mapping
the Seagrass
Resources of
North Carolina's
Core and Back
Sound
Mentors:
Don Field (vitae) and
Jud Kenworthy (vitae)
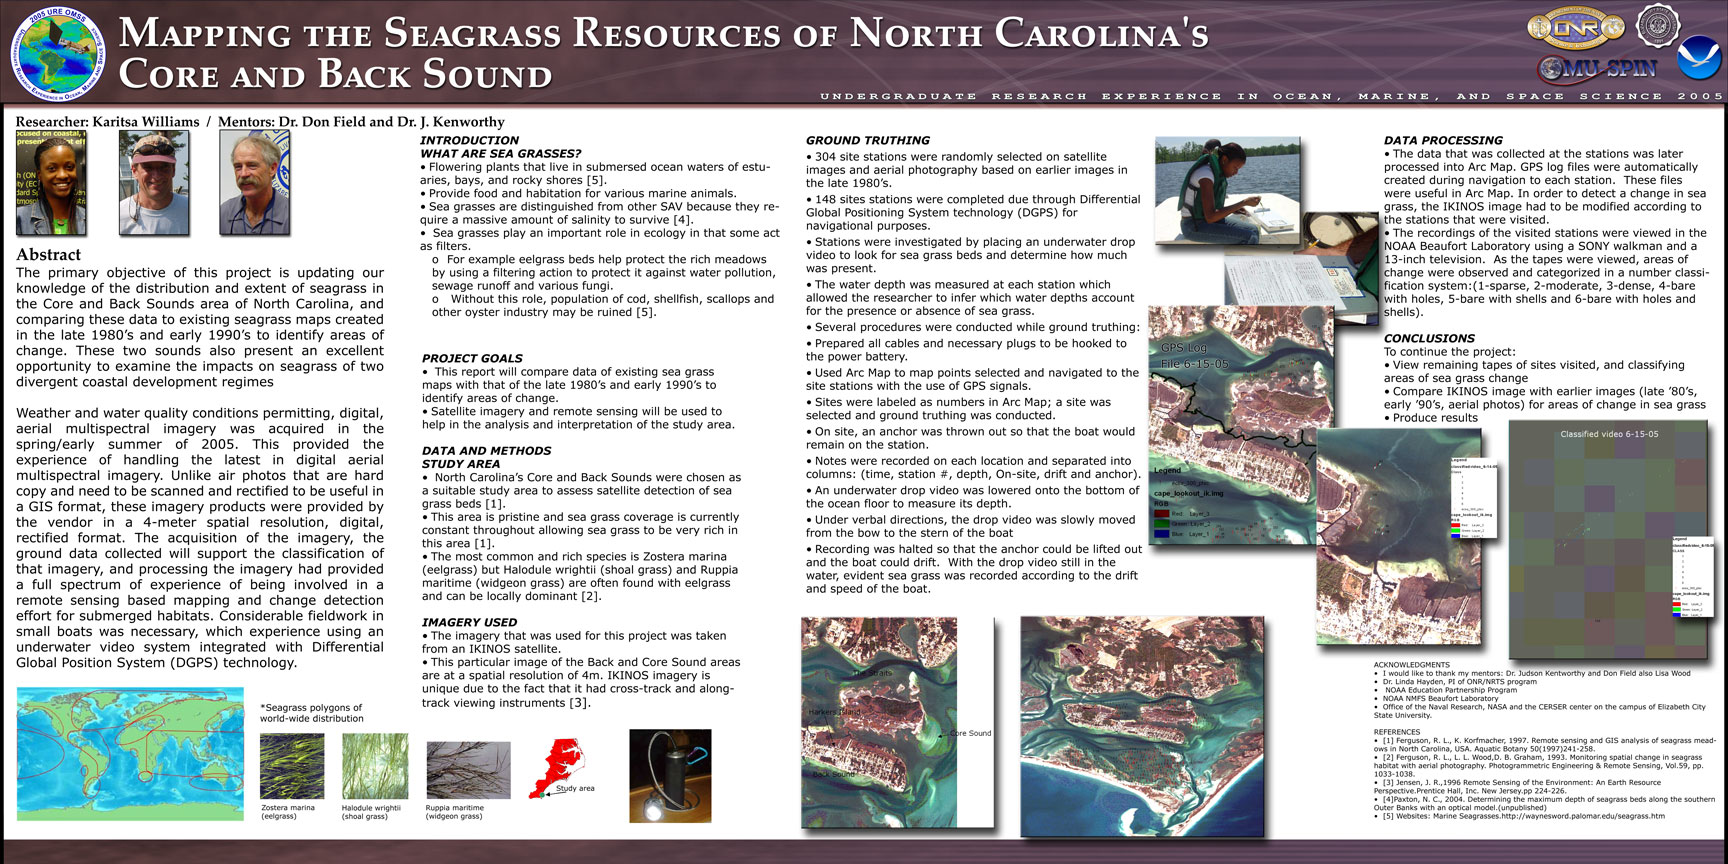
Abstract
The primary objective of this project is
updating our knowledge of the distribution
and extent of seagrass in the Core and
Bogue Sounds areas of North Carolina, and
comparing these data tko existing seagrass
maps created in the late 1980's and early
1990's to identify areas of change. These
two sounds also present an excellent opportunity
to examine the impacts on seagrass of two
divergent coastal development regimes:
the relatively pristine conditions of Core
Sounds versus the typical high beach and
coastal community development pressures
in Bogue Sound.
Weather
and water quality
conditions
permitting,
digital, aerial
multi spectral
imagery will
be acquired
in the spring/early
summer of 2005.
This will provide
the intern
with experience
handling the
latest in digital
aerial multi
spectral imagery.
Unlike air
photos that
are hard copy
and need to
be scanned
and rectified
to be useful
in a GIS format,
these imagery
products are
provided by
the vendor
in 1 meter
spatial resolution,
digital, rectified
format. The
acquisition
of the imagery,
the ground
data collection
that will support
the classification
of that imagery,
and processing
the imagery
will provide
the intern
with a full
spectrum of
experience
of being involved
in a remote
sensing based
mapping and
change detection
effort for
submerged habitats.
Considerable
field work
in small boats
may be necessary,
which will
give the intern
experience
using an underwater
video system
integrated
with Differential
Global Position
System (DGPS)
technology.
Prior skills: Experience with Arc View
and or Arc GIS
Helpful skills: Experience working in the
field particularly from small boats; experience
with DGPS technology |
Karitsa
Williams
CS-SR
kgwilliams@mail.ecsu.edu
Research Page
Research
Poster (JPG) |
| |
| Juniors |
 |
Overview
of Some Statistical
Methods Used
in Marine-Related
Environmental
and Toxicological
Studies
Mentors:
Hal Stanford, NOAA
Headquarters, National
Center for Coastal
Ocean Science
Larry
Claflin, NOAA Headquarters,
National Center
for Coastal Ocean
Science
Felicity
Burrows, NOAA Headquarters,
National Center for
Coastal Ocean Science
Abstract
The
main objective
of this project
was to overview
some statistical
methods used
in marine-related
environmental
and toxicological
studies. The
overview is based
on 33 scientific
papers on toxicology
and environmental
science. The
papers were examined
for the statistical
methods that
were used to
yield accurate,
robust, and comprehensible
results. My research
supported the
mission of NCCOS
(National Center
for Coastal Ocean
Science), which
is to providecoastal
managers with
scientific information
and tools needed
to balance society’s
environmental,
social, and economic
goals. |
Brandi
Brehon
CS-JR
brbrehon@mail.ecsu.edu
Research Paper
(PDF) |
| |
 |
Pre-Service
Teacher Evaluation
of NASA Educational
Resources
NASA Goddard Space
Flight Center
Abstract
As
an Education major,
concentrating in Math,
it’s important
that I take extra steps
in gaining the knowledge
necessary to effectively
communicate messages
to my students. To
me, apart of being
an educator requires
that I first gain my
students trust and
attention. In doing
this, it will allow
me to connect with
my students and also
secure their attention
to be receptive to
the message. Second,
make sure that students
understanding the message
and finally show them
that everything around
them is a window of opportunity to further
their understandings.
When I was given
the opportunity
to work with NASA,
I was amazed at
all the wonderful
and informative
resources that
were made available
to me. I knew that
this would be a
great place to
start in my quest
to prepare myself
for the task and
challenges I will
face in my efforts
to become a successful
educator.
NASA offered
me various levels
of training and
learning experiences,
ranging from CORE
(Central Operation
of Resources for
Educators) to SHARP
(Summer High School
Apprenticeship
Research Program).
As you read on
you will gain a
better understanding
of all the educational
materials that
I have evaluated
this summer. |
Garry
Cameron
Math
ED-JR
gbcameron@mail.ecsu.edu
Further Information |
| |
 |
Spatial-Explicit
Growth Rate Model
of Young Striped
Bass in Albemarle
Sound: Implications
on Essential
Fish Habitat
(EFH) Using GIS
Mentor:
Anthony S.
Overton,
Department
of Biology,
East Carolina
University
Brittany Green - SCSU, Quinton Moore
- SCSU, Jameson Gibbs - ECSU
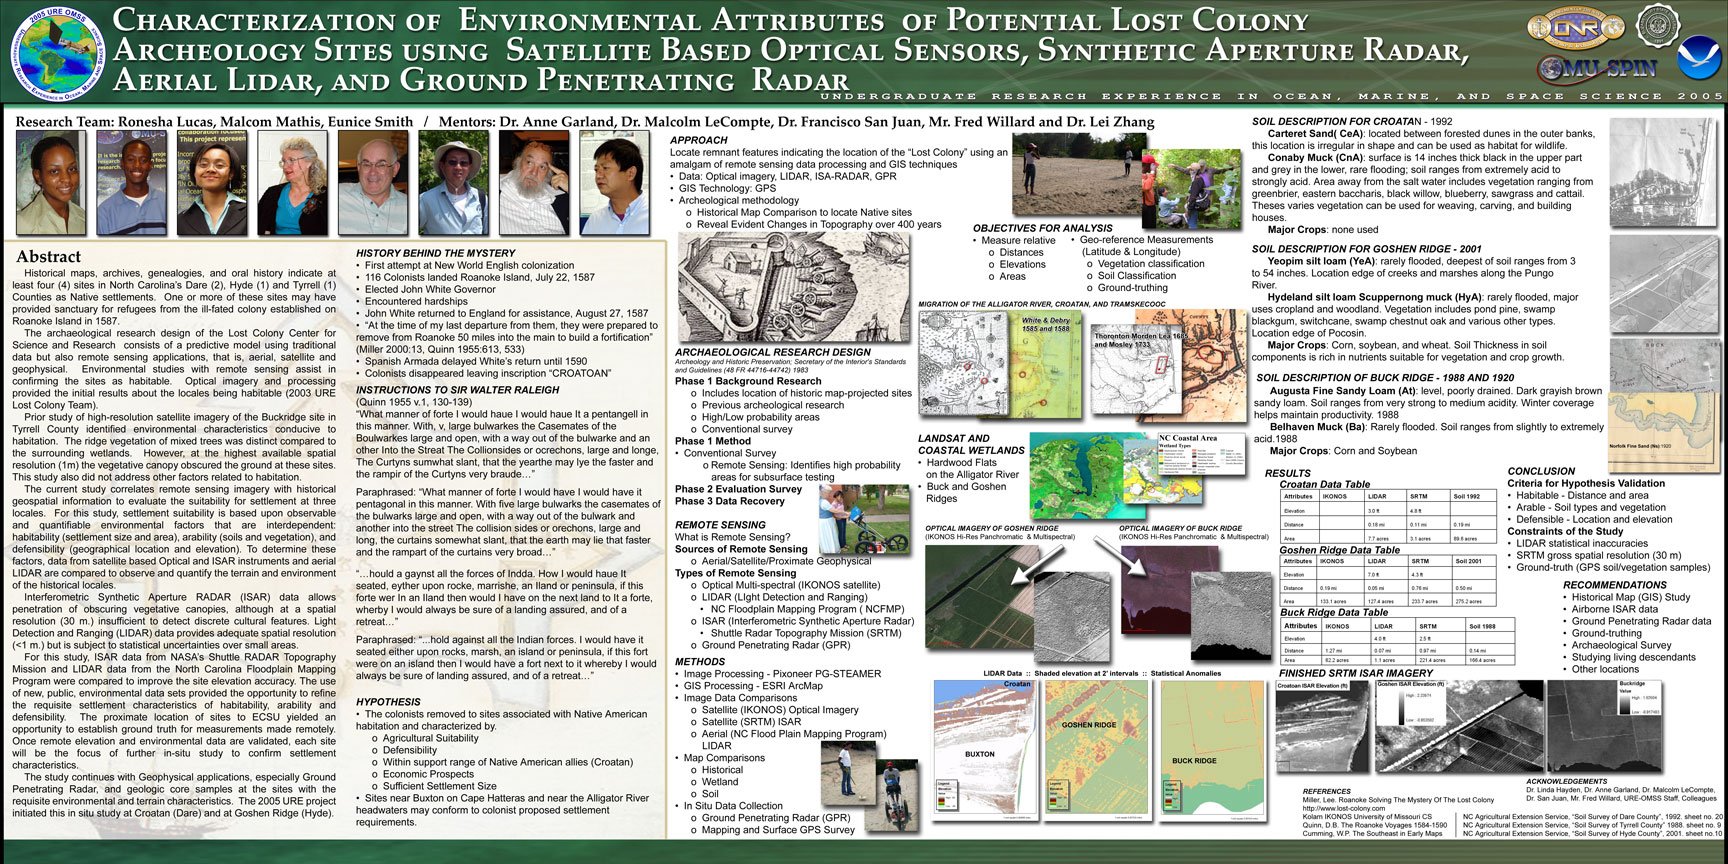
Abstract
Historical
maps, archives,
genealogies,
and oral history
indicate at
least four
(4) sites in
North Carolina’s
Dare (2), Hyde
(1) and Tyrrell
(1) Counties
as Native settlements.
One or more
of these sites
may have provided
sanctuary for
refugees from
the ill-fated
colony established
on Roanoke
Island in 1587.
The archaeological
research design
of the Lost Colony
Center for Science
and Research
consists of a
predictive model
using traditional
data but also
remote sensing
applications,
that is, aerial,
satellite and
geophysical.
Environmental
studies with
remote sensing
assist in confirming
the sites as
habitable. Optical
imagery and processing
provided the
initial results
about the locales
being habitable
(2003 URE Lost
Colony Team).
Prior study
of high-resolution
satellite imagery
of the Buck Ridge
site in Tyrrell
County identified
environmental
characteristics
conducive to
habitation. The
ridge vegetation
of mixed trees
was distinct
compared to the
surrounding wetlands.
However, at the
highest available
spatial resolution
(1m) the vegetative
canopy obscured
the ground at
these sites.
This study also
did not address
other factors
related to habitation.
The current
study correlates
remote sensing
imagery with
historical geospatial
information to
evaluate the
suitability for
settlement at
three locales.
For this study,
settlement suitability
is based upon
observable, interdependent,
quantifiable
environmental
factors governing
habitability
(settlement size
and area), arability
(soils and vegetation)
and defensibility
(geographical
location and
elevation). To
determine these
factors, data
from satellite
based Optical
and ISAR instruments
and aerial LIDAR
are compared
to observe and
quantify the
terrain and environment
of the historical
locales.
Interferometric
Synthetic Aperture
RADAR (ISAR)
data allows penetration
of obscuring
vegetative canopies,
although at a
spatial resolution
(30 m.) insufficient
to detect discrete
cultural features.
Light Detection
and Ranging (LIDAR)
data provides
adequate spatial
resolution (<1
m.) but is subject
to statistical
uncertainties
over small areas.
For
this study,
ISAR data from
NASA’s
Shuttle RADAR
Topography Mission
and LIDAR data
from the North
Carolina Floodplain
Mapping Program
were compared
to improve the
site elevation
accuracy. The
use of new, public,
environmental
data sets provided
the opportunity
to refine the
requisite settlement
characteristics
of habitability,
arability and
defensibility.
The proximate
location of sites
to ECSU yielded
an opportunity
to establish
ground truth
for measurements
made remotely.
Once remote elevation
and environmental
data are validated,
each site will
be the focus
of further in-
situ study
to confirm settlement
characteristics.
The study continues
with Geophysical
applications,
especially Ground
Penetrating Radar,
and geologic
core samples
at the sites
with the requisite
environmental
and terrain characteristics.
The 2005 URE
project initiated
this in
situ study
at Croatan (Dare)
and at Goshen
Ridge (Hyde).
|
Ronesha
Lucas
BIO-JR
ping_89@hotmail.com
Research
Page
Research
Paper (PDF)
Research
Poster (JPG) |
| |
 |
Using
Ensemble Learning
for Dectect Data
Abnormaties in
Databases
Mentors:
Drs. P. Gogineni, C.
Tsatsoulis, and Miss.
D. Lee
2005
Research Experience
for Undergraduates
(REU)
The University of Kansas
Abstract:
Software
engineers at
the University
of Kansas have
developed SmartXAutofill,
an intelligent
data entry assistant
for predicting
and automating
inputs for eXtensible
Markup Language
(XML) and other
text forms based
on the contents
of historical
documents in
the same domain.
SmartXAutofill
utilizes an ensemble
classifier, which
is a collection
of a number of
classification
algorithms where
each individual
internal classifier
predicts the
optimum value
for a particular
data field. As
the system operates,
the ensemble
classifier learns
which individual
internal classifier
works better
for a particular
domain and adapts
to the domain
without the need
to develop special
classifiers.
The ensemble
classifier has
proven that it
performs at least
as well as the
best individual
internal classifier.
The ensemble
classifier contains
a voting and
weighting system
for inputting
values into a
particular data
field.
Because the existing technology can predict,
suggest and automate data fields, the investigator
tested whether the same technology can be
used to identify incorrect data. Given existing
data transmitted by sensors and other instruments,
the investigator studied whether the ensemble
classifier technology can identify data abnormalities
and correctness in future sensor data transmission.
The solution would be applied in a project
funded by the National Science Foundation,
Polar Radar for Ice Sheet Measurements (PRISM),
using innovative sensors to measure the thickness
and characteristics of the ice sheets in
Greenland and Antarctica, with the goal of
understanding how the ice sheets are being
affected by global climate change.
PRISM sensors continuously
send information
that is collected
and catalogued. The
ensemble classifier
will check the data
for correctness by
predicting which
values should be
there, and if the
actual values are
different, it will
flag the data as
possibly corrupted,
and allow an operator
to later study it
and determine if
it is correct or
not. This technology
will allow the PRISM
intelligent systems
to automatically
determine the correctness
of sensor and other
data, and contributes
to the PRISM project
by adding a level
of intelligence and
prediction to the
sensor suite. |
Jerome
Mitchell
CS-JR
jemitchell@mail.ecsu.edu
Full Paper (PDF) |
| |
| Sophomore |
 |
Migratory
Bottlenose Dolphin
Movements and Numbers
Along the Mid-Atlantic
Coast and Their
Correlation with
Remotely Sensed
Chlorophyll-a and
Sea Surface Temperatures
Mentor: Kevin Foss
Patrice Armstrong,
Cheniece Arthur,
and Chakara Murray
Abstract
Along
the Mid-Atlantic
coast of
the United
States , there
are different
sub-populations,
or stocks
of bottlenose
dolphins.
The bottlenose
dolphin, Tursiops
truncatus, has
both resident
and migratory
stocks. The
focus of
this study
is the northern
migratory
population.
This group
of animals
moves north
and south
along the
coast in
response
to seasonal
changes.
The need
for study
arises from
this mobile
nature. Determination
of the environmental
cues that
may be used
to predict
the presence
or absence
of these
animals will
aid in efforts
to avoid
disturbance
to this protected
species.
This stock
was also
greatly affected
during the
1987-1988
epizootic
event that
killed an
estimated
50% of the
migratory
stock. This
disease event
was likely
worsened
by exposure
to environmental
toxins. The
main areas
of the field
work, the
lower James
and Elizabeth
Rivers of
Virginia
, are of
interest
due to their
high toxin
loads and
frequent
usage by
bottlenose
dolphins.
The Elizabeth
River is
largely developed
along its
length. It
also has
a very high
level of
traffic:
commercial,
military
and recreational.
Since
this species
represents
the highest
level on its
food chain,
our hypothesis
is that the
movement north
represents
can be correlated
with the movements
of their prey
species. These
prey species
are known to
be themselves
migratory with
temperature.
As a surrogate
for the in
situ detection
of the prey
species, we
feel that sea
surface temperature
(SST) and chlorophyll-a
levels can
be used. Both
of these factors
can be sensed
remotely, removing
the need for
local observations.
Sea surface
temperature
can serve to
represent the
movement of
the prey species,
and chlorophyll-a
levels can
be used to
show the primary
productivity,
and thus the
total food
energy available
in the ecosystem.
The presence
and absence
data on these
animals is
then to be
compared with
the remotely
sensed SST
and chlorophyll-a
data. These
data were derived
from a number
of sources.
MODIS-Aqua
and AVHRR data
was obtained
from Goddard
Space Flight
Centers Ocean
Color web archive.
Additional
AVHRR data
was obtained
from the Jet
Propulsion
Laboratory’s
PO.DAAC Ocean
ESIP Tool (POET)
website. Field
observations
were based
on archives
from the Christopher
Newport University
Dolphin Project,
and from the
Ocean Biogeographic
Information
System ( OBIS)
archive of
Duke University
.
The
results of the correlations
show that the critical
temperature in determining
the presence or absence
of bottlenose dolphins
is between 16° and
18° C. While
there were two sightings
below this temperature,
there were 694 above.
A t-test show that
there was a significant
(p=0.003) difference
between the mean
temperatures of sighting
and non-sighting
efforts. When compared
to the numbers of
animals sighted at
the different temperatures,
again the 16° and
18° critical
temperatures showed
up. There were only
2 animals sighted
below 16°, while
there were 5400 sighted
above. An ANOVA analysis
showed a significant
(p<0.01) difference
between the two temperature
ranges when it came
to group size. A
t-test for the mean
group size showed
no significant difference
in the sizes of groups
between 18° and
28°. While there
was some variation
in the chlorophyll
levels (measured
in mg/m 3), a t-test
showed no significant
(p>0.1) difference
between the means
of sighting and non-sighting
levels. In comparing
chlorophyll-a levels
with group size,
there was a significant
(p<0.001) difference,
but this was likely
due to the fact that
coastal waters never
drop below moderate
chlorophyll-a levels.
Based on these findings,
it becomes clear
that in determining
the migratory movements
of bottlenose dolphins
sea surface temperature
is the preferred
environmental variable. |
Cheniece
Arthur
CS-SO
clarthur@mail.ecsu.edu |
| |
 |
National
Oceanographic
Atmospheric Administration
Stock Assessments
Mentor: Michael Prager, Ph.D.
Population Dynamics Team, NMFS SE Fisheries
Science Center, NOAA Center for Coastal
Fisheries and Habitat Research
Authors: Anthony Anderson and Kaiem Frink
Abstract
We developed an interface between two software
packages we use, AD Model Builder (ADMB) and the statistics
package R. Both packages offer high-level programming languages. We used ADMB language
to fit models, and then used R to graph them. When fitting a model with ADMB,
a mass of data is generated that must be graphed to understand the modeling
results. Our interface contains code that allows an ADMB program to output data in
a format readable by R, and it also contains a set of graphics functions in R that make
dozens of standard graphs.
The
benefits to NOAA
and the Population
Dynamics Team will
be mainly an improved
graphics function.
We have increased
familiarity with
scientific programming
in general, and
programming in
the R language
in particular |
|
| |
|
|
| |
|


