| Undergraduate Research Experience in Ocean Marine and Space Science |
|
|
      |

|
Results |
|
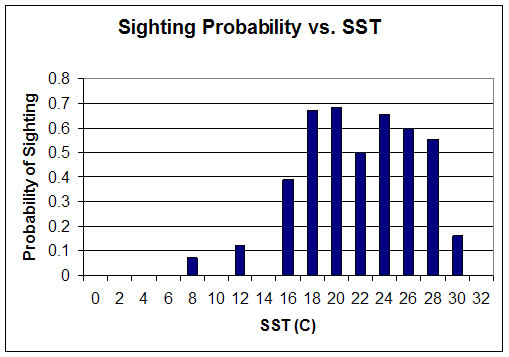
We compared SST against the probability of sighting animals. Plotting the data out, we got the graph:
This shows that above the temperature 16? C, you have a much greater chance of sighting dolphins. There are two sightings below this temperature, but these are sightings of single animals, and don’t represent the majority. There are only two sightings below 16°, and 694 above, so these represent rare events. There is also a decline in the sightings above 28°, which may represent the point where they begin to undergo thermal stress. A t-test showed that there was a significant (p=0.003) difference between the means temperatures where the animals were sighted and when they were not. |
|
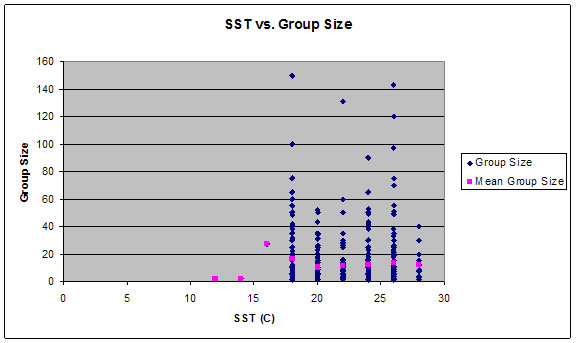
When we looked at the number of animals sighted, we got the following graph:
This shows that again, there is a sharp drop-off of the number of animals sighted below 16°. Of the sightings where the number of animals was recorded, only one was at 16°, and two below that point. It should be noted that the two below represent sightings of single animals. So we have 2 animals sighted below 16°, and a total of 5400 at 16° and above. An ANOVA analysis was performed on the data, and this showed a significant difference (p<0.01) between the temperatures where they were found and where they were not. A t-test comparison of the mean values for the range of temperatures showed no, significant difference in the mean group size between 18° and 28°. |
|
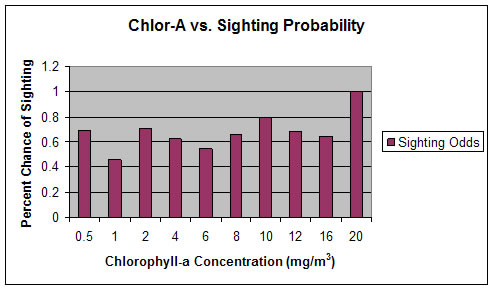
When the levels of chlorophyll were examined in the same ways, it was found that the odds of sighting resulted in the following graph:
While there is some variation in the percent chance of sighting dolphins across the range of chlorophyll-a concentrations observed, a t-test showed no significant (p>0.1) difference between the means for the level where dolphins were sighted and where they were not. |
|
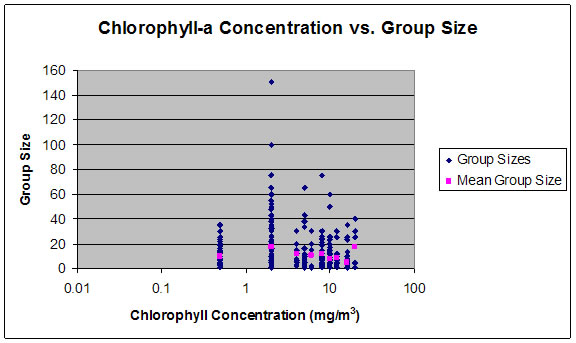
A comparison between the level of chlorophyll-a and the number of animals sighted gives the following graph:
This data shows that there is a significant (p<0.001) difference in the mean group sizes, but this reflects the relatively high levels of chlorophyll-a found in coastal waters. There was no real difference in the numbers of sightings at the different temperatures |