|
 |
Research Experiences for Undergraduates Projects with
Community Grid Lab of Pervasive Technology Institute at Indiana University
STEM Scholars Institute, Summer 2010 |
|
Project 4. Visualization of Ice Sheet Elevation Data Using Google Earth & Python Plotting Libraries
Student: Michael Austin, JerNettie Burney, Nadirah Cogbill, and Robyn Evans |
|
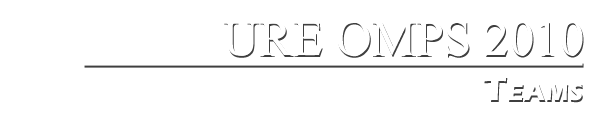
Polar Grid is a National Science Foundation (NSF) MRI funded partnership of Indiana University and Elizabeth City State University whose purpose is to obtain the necessary information needed to bring awareness to the urgent problems in glacial melting. Formed by the NSF in 2005, the Center for Remote Sensing of Ice Sheets (CReSIS) strives for the development of technologies that allows them to be able to measure and predict any change of sea level caused by a mass balance of ice sheets, located in both Greenland and Antarctica. The airborne program utilizes a 150 MHz radar echo sounder to measure the thickness of ice.
Both CReSIS and the Polar Grid Project partner together offering research in a selection of majors for students and faculty to work with various scientists and engineers to aid the constant study of what different factors may play a part in the ongoing change of the climate. During the 2010 STEM Summer Scholars undergraduate research experience at Indiana University, students were tasked with creating visual representations of the ice thickness and bed elevation of the Greenland ice-sheet. A dataset consisting of the latitude, longitude, thickness, elevation and surface elevation was used to create both a contour and heat map.
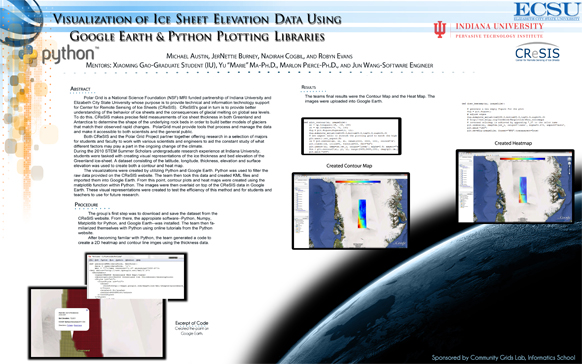
The visualizations were created by utilizing Python and Google Earth. Python was used to filter the raw data provided on the CReSIS website. The team then took this data and created KML files and imported them into Google Earth. From this point, contour plots and heat maps were created using the matplotlib function within Python. The images were then overlaid on top of the CReSIS data in Google Earth. These visual representations were created to test the efficiency of this method and for students and teachers to use for future research. |
|
|
|
|
|