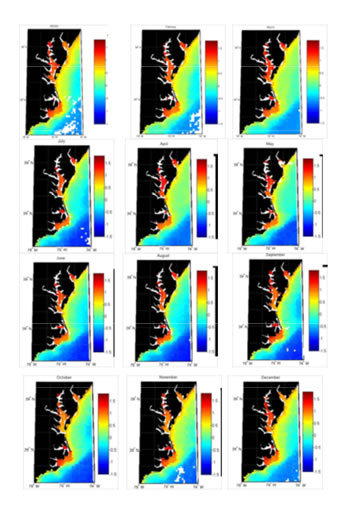
| In conducting our research, we used Giovanni, the GES-DISC Interactive On-line Visualization and Analysis Infrastructure. It serves as a source for the information gathered from both Sea WiFS and MODIS. The data for chlorophyll a (chl a) was gathered for each month from January 1998-December 2007. The average chlorophyll a for each month was calculated by placing each month's data into Microsoft Excel. The averages were then placed into Matlab to show a visualization for each month's chlorophyll a concentrations in the area. Giovanni also allowed the processing of data for Chlorophyll a and Sea Surface Temperature (SST)for Chesapeake Bay and Albemarle Sound. The data was generated into charts for each area in regards to chl a and SST for both regions as well as an animation for the entire coast of North Carolina. Below is the average chl a for each month starting with January 1998. The other images are provided throughout the paper, powerpoint, and poster. |
