|
|
| Research
Goal:
Focus on automating task of estimating ice thickness.
Process:
Identifying and accurately selecting of ice sheet’s surface, interface between the ice, and the bedrock.
Knowing the surface and bedrock in the radar images:
helps compute the ice thickness.
help studies relating to the ice sheets, their volume, and how they contribute to climate change. |
 |
|
 |
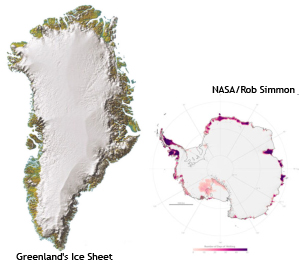
| Surfaced-based and Airborne radio echo sounding of Greenland and Antarctica ice sheets Determine ice sheets thickness Bedrock Topography (smooth, rough)
Mass Balance of large bodies of ice. |
|
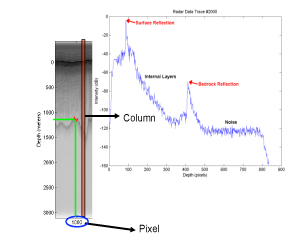
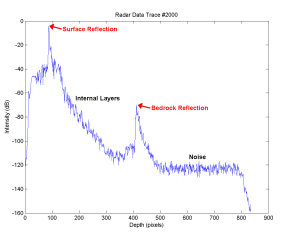
Each measurement is called a radar trace, and consist of signals, representing energy due to time. The larger time correlates with deeper reflections. |
 |
|
 |
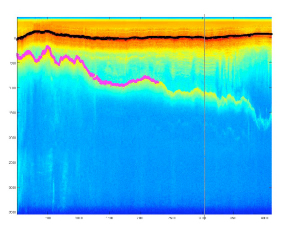
| A flight segment consist of a collection of traces which represent all the columns of the image, from the beginning (left) to the end (right) during flight. |
|
Reflection intensities are strongest at the surface and weaker because of depth. Depth increases from left to right. |
 |
|
 |
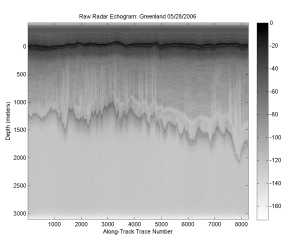
| CReSIS picking software, the surface return is fully picked, while bedrock return is partially picked. |
|
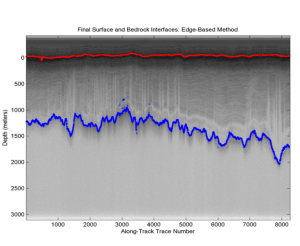
Echogram with overlaid automatically selected surface (top, red) and bedrock (middle, blue) layers using the edge-based method. |
| |
|