
Powerpoint (PPT)
Research Paper (PDF)
Poster(JPEG)
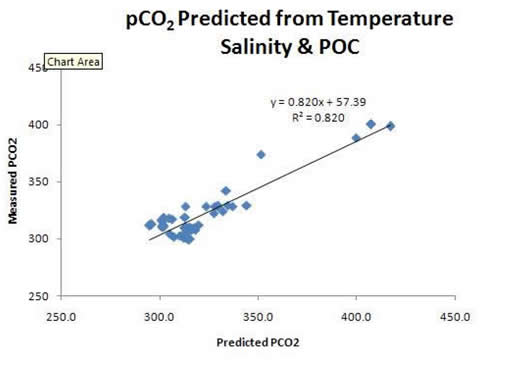
Chart 1. Comparison between the Predicted, and Measured pCO2 with POC.
Temperature, Salinity, and Chlorophyll a were used to calculate pCO2.
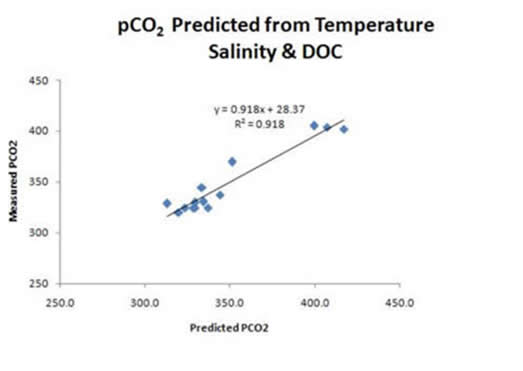
Chart 2. Comparison between the Predicted, and Measured pCO2 with DOC.
Temperature, Salinity, and Chlorophyll a were used to calculate pCO2.