Figure 6. The correlation of the area of hypoxia verses the mean sea surface chlorophyll a measured by satellite. The area of hypoxia was determined by Dr. Rabalais during annual survey.
There was a positive correlation between the size of hypoxia and sea surface chlorophyll a. The correlation was moderate with a r = 0.74. It appears that the correlation was excellent for mean chlorophyll a of less than 7(mg m -3).Although the dissolved oxygen in bottom waters appeared to decrease with the increase of chlorophyll in surface waters, the correlation was not very good (Figure 7). Part of the problem is that data from deeper regions are mixed together with coastal regions.
Figure 7. The distribution of dissolved oxygen in bottom waters based on survey of July 2006. The x marks represents the location of field measurements conducted.
In Figure7. Hypoxia was detected in near shore regions only in 2006. These regions include areas near the mouth of Atchafalaya River and Mississippi River. The size of hypoxia is abnormal in 2006.
Figure 8. The correlation between dissolved oxygen bottom waters and chlorophyll fluorescence in surface waters.
Figure 9. Variation of correlation coefficient depths. Correlation coefficient is between dissolved oxygen in bottom waters and chlorophyll a in surface waters.
With the successive elimination of deeper samples, the correlation coefficient increased from 0.35 to approximately 0.5 (Figure 8.). This trend supports the notion that hypoxia develops in costal regions.

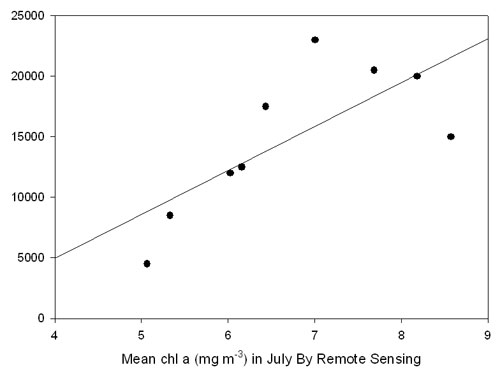 Figure 6. The correlation of the area of hypoxia verses the mean sea surface chlorophyll a measured by satellite. The area of hypoxia was determined by Dr. Rabalais during annual survey.
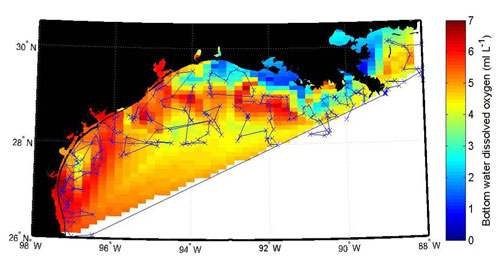 Figure 7. The distribution of dissolved oxygen in bottom waters based on survey of July 2006. The x marks represents the location of field measurements conducted.
 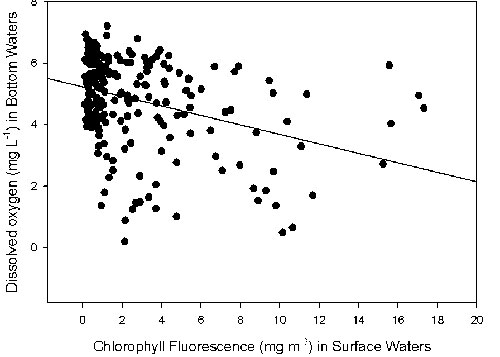 Figure 8. The correlation between dissolved oxygen bottom waters and chlorophyll fluorescence in surface waters.
 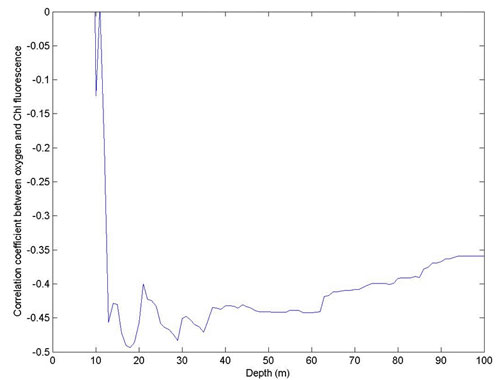 Figure 9. Variation of correlation coefficient depths. Correlation coefficient is between dissolved oxygen in bottom waters and chlorophyll a in surface waters.