 |
Automating the TeraScan Image Process for Creation of NOAA AVHRR Data Products
Mentor: Mrs. Keisha Wilkins, Elizabeth City State University - CERSER
Undergraduate Research Experience in Ocean and Marine Science 2006
Abstract
During the summer of 2002 the Center of Excellence in Remote Sensing Education and Research (CERSER) was established on the campus of Elizabeth City State University. It is the intent of CERSER to develop innovative and relevant research collaboration focused on coastal, ocean, and marine research. The project represents a joint effort by the Office of Naval Research (ONR), the MU-SPIN Office of Goddard Space Flight Center (GSFC), the National Oceanic and Atmospheric Administration (NOAA) and SeaSpace.
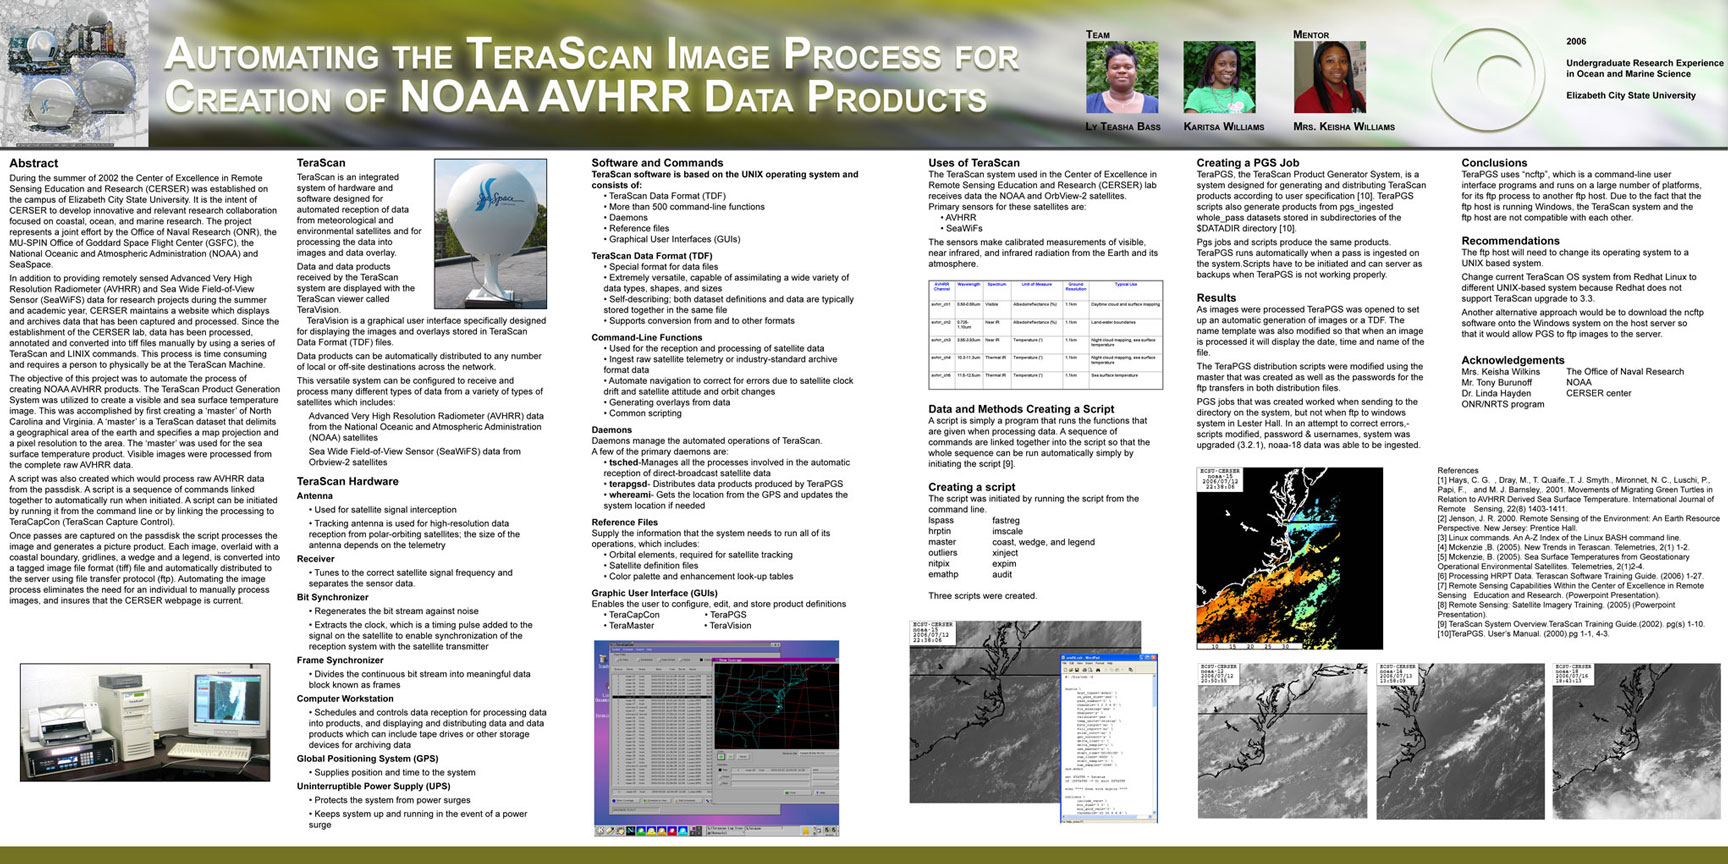
In addition to providing remotely sensed Advanced Very High Resolution Radiometer (AVHRR) and Sea Wide Field-of-View Sensor (SeaWiFS) data for research projects during the summer and academic year, CERSER maintains a website which displays and archives data that has been captured and processed. Since the establishment of the CERSER lab, data has been processed, annotated and converted into tiff files manually by using a series of TeraScan and LINIX commands. This process is time consuming and requires a person to physically be at the TeraScan Machine.
The objective of this project was to automate the process of creating NOAA AVHRR products. The TeraScan Product Generation System was utilized to create a visible and sea surface temperature image. This was accomplished by first creating a master of North Carolina and Virginia. A master is a TeraScan dataset that delimits a geographical area of the earth and specifies a map projection and a pixel resolution to the area. The master was used for the sea surface temperature product. Visible images were processed from the complete raw AVHRR data.
A script was created which processes raw AVHRR data from the passdisk. A script is a sequence of commands linked together to automatically run when initiated. A script can be initiated by running it from the command line or by linking the processing to TeraCapCon (TeraScan Capture Control).
Once passes are captured on the passdisk the script processes the image and generates a picture product. Each image, overlaid with a coastal boundary, gridlines, a wedge and a legend, is converted into a tagged image file format (tiff) file and automatically distributed to the server using file transfer protocol (ftp). Automating the image process eliminates the need for an individual to manually process images, and insures that the CERSER webpage is current.
|
| |

Cheniece Arthur
Junior - CS
clarthur@mail.ecsu.edu

Bryce Carmichael
Sophomore - CS
blcarmichael@mail.ecsu.edu
Research Page
Research Paper (PDF)
|
University of Kansas Robotic Simulation Team
Mentor:
Abstract
The primary objective of our project is, to successfully create a
robotic simulation that shows how numerous robots will assemble in
order to collect seismic data. In contrast to the human approach of
physically deploying and receiving seismic data, robots would instead
be used to collect data. Once a designated location has been
determined, the robot will plant the geosensor and collect the
vibration data after the seismic source has taken place. With the use
of robots, human life is not at risk. Due to the harsh and dangerous
weather conditions in the Antarctic and Greenland environment, robots
would replace manual labor. With an abundance of robots, we will be
able to collect a large amount of data over a short period of time.
We have used a 3-D graphical interface program called "Webots" to simulate how a team of mobile robots will assemble into grid formation and migrate from one location to another. Webots is a mobile robotic simulation software package that allows one to model robots and test in a world created by the user. This program uses physics as well as code to validate and test different methods when an action is declared. As we continue our knowledge within Webots, we plan to create and test different formations using the robots in the program. The formations will work in different shapes and patterns in order to follow their desired paths. |
| |
 Unquiea Wade
Freshman - CS
unwade@mail.ecsu.edu Research Page
Research Paper (PDF)
Research Poster (JPG) |
Airborne Measurement of Snow Thickness Over
Sea Ice
Mentor:
Abstract
Snow cover on sea ice plays an important role
in the climate of the polar regions. Snow on the sea ice
reduces the heat exchange between the ocean and the
atmosphere by its high albedo (reflectivity) and low
thermal conductivity. The lower the albedo, the less solar
energy is reflected back into the atmosphere. This energy
is absorbed into the ocean. The warmer water will melt
more sea ice, and eventually the warmer atmosphere
above the warmer water will melt more of the sea ice in
the polar regions. Better data on the extent and thickness
of snow cover are therefore needed to understand the
condition and future behavior of sea ice.
Up until recently, the only practical means of observing
snow cover over sea ice was by satellite remote sensing.
The Advanced Microwave Scanning Radiometer (AMSRE)
onboard NASA’s Aqua satellite does precisely this. To
validate the measurements made by AMSR-E, the
University of Kansas developed an ultra-wideband
frequency-modulated continuous-wave (FM-CW)
airborne radar to measure snow thickness over sea ice.
This system was flown over the Arctic sea ice in March
2006 to measure the snow thickness.
|
| |
 Jerome Mitchell
Senior - CS
jemitchell@mail.ecsu.edu
|
Using Active and Passive Microwave Records For Detecting Firn Characteristics In Greenland: A New Indication Of Melt
Mentor:
Dr. Mark Fahnestock
University of New Hampshire
Abstract:
Satellite-based active microwave imaging instruments (Synthetic Aperture Radars and Scatterometers) and passive microwave radiometers are recording the modification of the structure of the firn, the compacted snow layer that has remained at or near the surface of an ice sheet for one season but has not yet compressed into glacial ice, on the Greenland ice sheet caused by new melting at high elevation. Even a few days of melt at a site on the ice sheet that has not melted in decades can produce a large sustained change in the microwave scattering properties of the snowpack; this change is clearly reflected for years, diminishing only slowly as the layer generated by the melt event is buried. In the last 5 years, x% of the area of the dry snow zone has been modified in this manner by surface melt, compared with y% (little modification) in the previous 9 (to 13 or 20+ years, depending on the data used); these effects decay slowly, and if the present trend toward increased melting continues, the dry snow zone (melt-free snowpack) of the interior of Greenland could disappear completely in the near future. A melt detection technique calculated data for the passive microwave record, and it produced an approximate amount of melt days compared to the active microwave records done by previous investigators; this allowed for a new indication of melt as well as greater time series in the passive microwave record.
|
| |
 |
Estimating Antarctic Firn Average Emissivity Trends at the Ski Hi Automatic Weather Station
Mentor:
Dr. Malcolm LeCompte
Ellizabeth City State University - CERSER
Abstract
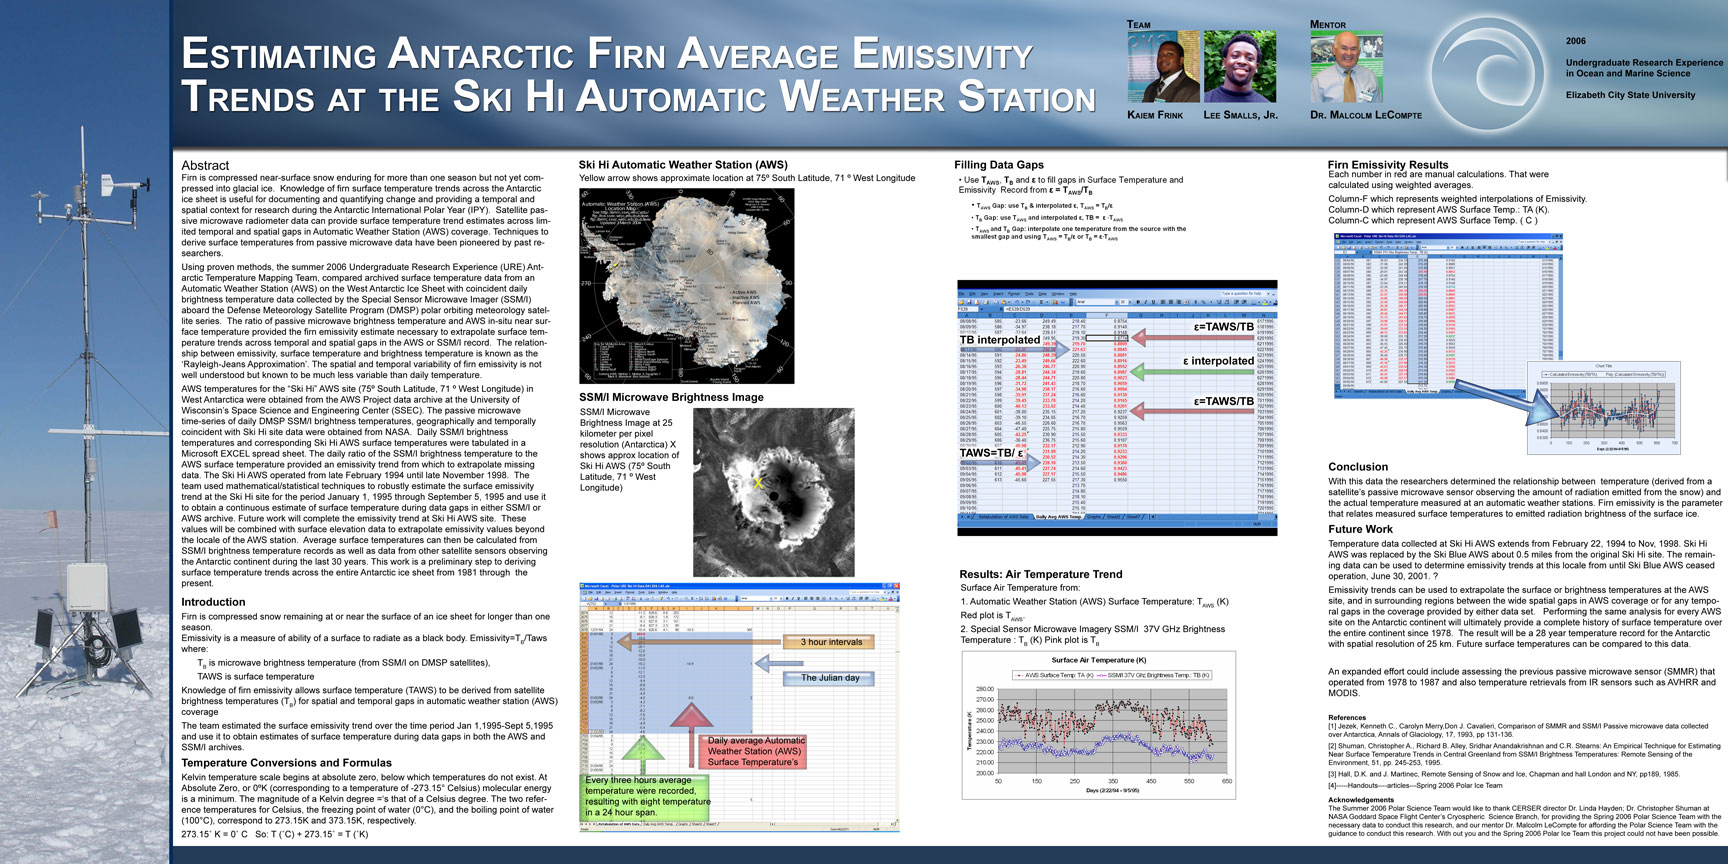
Firn is compacted, near-surface snow enduring for more than one season not yet compressed into glacial ice. Knowledge of firn surface temperature trends across the Antarctic ice sheet is useful for documenting and quantifying change and providing a temporal and spatial context for research during the Antarctic International Polar Year (IPY). Satellite passive microwave radiometer data can provide surface temperature trend estimates across limited temporal and spatial gaps in Automatic Weather Station (AWS) coverage. Techniques to derive surface temperatures from passive microwave data have been pioneered by Jezek et al., (1993) and. Shuman et al., (1995).
Using the methods of previous researchers, the Summer 2006 Undergraduate Research Experience (URE) Antarctic Temperature Mapping Team, is comparing archived surface temperature data from an AWS on the West Antarctic Ice Sheet with coincident daily brightness temperature data collected by the Special Sensor Microwave Imager (SSM/I) aboard the Defense Meteorology Satellite Program (DMSP) polar orbiting meteorology satellite series. The ratio of passive microwave brightness temperature and AWS in-situ near surface temperature provides the firn emissivity estimate necessary to extrapolate surface temperature trends across temporal and spatial gaps in either the AWS or SSM/I record. The relationship between emissivity and surface temperature is generally known as the ‘Rayleigh-Jeans Approximation’ (Hall and Martinec, 1985). The spatial and temporal variability of firn emissivity is not well understood but known to be much less variable than daily temperature.
AWS temperatures at 3 hourly intervals for the “Ski Hi” AWS site (75º South Latitude, 71 º West Longitude) in West Antarctica were obtained from the AWS Project data archive at the University of Wisconsin’s Space Science and Engineering Center (SSEC). The passive microwave time-series of daily DMSP SSM/I brightness temperatures, geographically and temporally coincident with the Ski Hi site were obtained from Dr. Chris Shuman at NASA Goddard. Daily SSM/I brightness temperatures and corresponding Ski Hi AWS surface temperatures were tabulated in a Microsoft EXCEL spread sheet. The daily ratio of the SSM/I brightness temperature to the AWS surface temperature provided an emissivity trend from which to extrapolate surface temperatures The Ski Hi AWS operated from late February 1994 until late November 1998. The team will develop mathematical/statistical techniques to robustly estimate the surface emissivity trend at the Ski Hi site for the period January 1, 1995 through November, 1998, and use it to obtain a continuous estimate of surface temperature during data gaps in either the SSM/I or the AWS archive. Future work will establish emissivity trends at other AWS sites. These values will be combined with surface elevation data to extrapolate emissivity values beyond the locale of the AWS stations. Average surface temperatures can then be calculated from SSM/I brightness temperature records as well as data from other satellite sensors observing the Antarctic continent during the last 30 years.This work is thus a preliminary step to deriving a surface temperature trend across the entire Antarctic ice sheet from 1981 through to the present.
|
| |
|

|
Data/Visualization Team
Mentors: Dr. Raj Chaudhury & Dr. Lin Chambers
NASA SPHERE 2006 - Christopher Newport University (CNU)
Abstract
This summer the Data/Visualization Team was responsible for creating a google map of local and remote GLOBE sites and their data on environmental phenomena that are linked using Google Maps and GPS (Global Positioning Service). Also the team created a walking tour of CNU and the Shenandoah Valley. The LAS stores satellite data on cloud coverage, surface Temperature, tropospheric ozone and other parameters, which is monitored by ground stations. This information will be linked to the google map to display the climate factors of each specific area. This information is useful for everyone, it makes it easy to identify geographical locations and their associated data from both satellite and ground stations.
|
| |
|

Anthony Anderson
Web Page
Senior - CS
bgneiss@adelphia.net
|
Massachusetts Young-of-the-Year Bottom Trawl Survey
Mentor: Dr. David Stevenson
Abstract
Designating essential fish habits are important because they protect specific species of fish from becoming extinct. To help aid the process we took a look at young of the year species in the north east region of the United States.
We are interested in knowing anything that will affect the numbers of young-of-the-year (YOY) juveniles caught in each survey and the environmental variables that could be correlated with geospatial data on catch rates (number of fish per tow).
|
| |
|
| |
|
|


