SeaSpace Terascan GOES Multispectral Animations
Elizabeth City State University
Spring 2014
Mentor: Dr. Malcom LeCompte
Project Website Link
Keywords: GOES, weather satellites, image loops, image animations, near-real time Earth Environmental satellite coverage
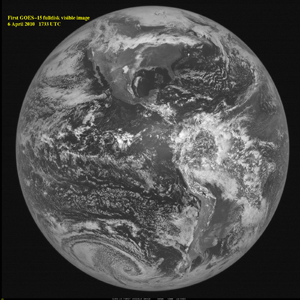
Installation of the two SeaSpace Terascan Geostationary Operational Environmental Satellite (GOES) receivers in July, 2013 provides ECSU’s CERSER laboratory with a capability to capture and generate the most current image data available of the Earth’s Western Hemisphere environment. The data is provided in an operational mode defined by the limitations of the GOES scanning imaging system. The GOES system operations are scheduled by the National Oceanic and Atmospheric Administration (NOAA) to provide various obligated environmental products, primarily to support numerical meteorological prediction services to different regions of the Western Hemisphere.
A principal advantage of any remote sensing system located in Geostationary orbit lies in the ability to create ‘loops’ or animations that reveal changes that occur in the Earth’s environment. The GOES imaging system or baseline imager, provides scanned images in five (5) wavelength bands, each of which provides different meteorological information to weather forecasters:
Channel 1: Visible (panchromatic, 0.52 to 0.71 μm), Image sequences provide high spatial resolution (1 km/pixel) animations of daytime cloud cover and wind velocities.
Channel 2: Short Wavelength Infrared (3.73 to 4.07 μm), Image sequences provide night cloud cover animations and wind velocities.
Channel 3: Middle-Wavelength Infrared (5.80 to 7.03 μm), Image sequences provide water vapor content animations and velocities.
Channel 4: long-wavelength or thermal Infrared (10.20 to 11.20 μm), Image sequences provide day and night cloud cover and water vapor animations and wind velocities and sea surface temperatures.
Channel 6: long-wavelength Infrared (13.00 to 13.70 μm), Image sequences provide day and night cloud cover animations and cloud heights.
Spatial resolution of all Infrared channels is 4 km/pixel.
NOAA maintains two operational GOES systems in orbit; one at 75° West Longitude provides environmental coverage to the East Coast and Western Atlantic Ocean while the other at 135° West Longitude. Providing imagery rarely more than 30 to 45 minutes time-late, the GOES system provides the most current continuously current coverage to the west coast and eastern Pacific Ocean.
Data from the two operational GOES satellites and other Remote sensing satellites can be combined to create new data products that may have utility in a number of specialized applications. The first step in creating innovative data products is to learn the functionality of the SeaSpace Terascan system.
The GOES Data Products Team will learn to create remote sensing data animations using the Terascan system. Their objective will be to create an animation of the visible disk of the Earth in all five channels and a similar animation at maximum spatial resolution of the Southeastern United States and especially the state of North Carolina and its coastal environment. Most important will be creating animations at Visible wavelengths and mid and one of the thermal IR channels.
The Use Of Parallelization Support To Speed Up PlotViz3
Indiana University Bloomington
Summer 2014
Mentor: Dr. Geoffrey Fox
Project Poster
Keywords: Bioinformatics, Genomic Sequences, PlotViz3, Phylogenetic Trees, Multithreading, Parallelization, C++
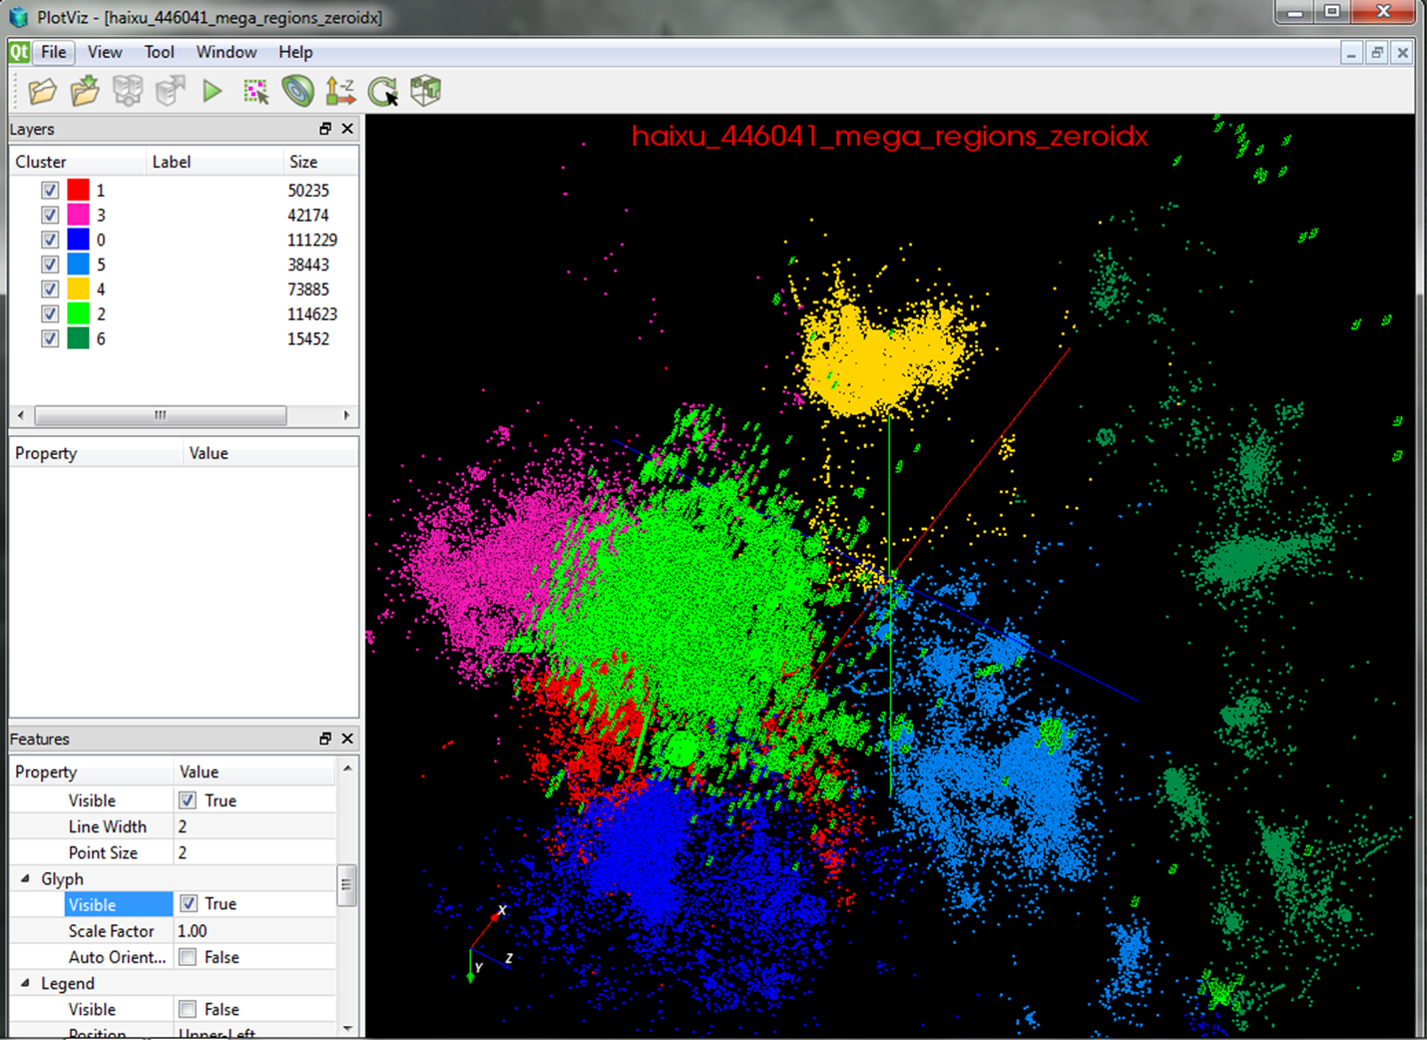
In biology there is a scientific field that develops methods and software tools for organizing and analyzing biological data. That field is bioinformatics and it combines computer science with other fields in order to study biological data and processes which in turn can provide meaningful information on genomic sequences. Currently, there is a software called PlotViz3, a three-dimensional data point browser, which can be helpful for scientists in the field of bioinformatics.
PlotViz3 can be used to interactively discover intrinsic structures efficiently of which are high-dimensional and contain large volumes of data. This means that scientists will be able to find the correlations between the DNA sequence clusters that they have data for more effectively than their previous methods such as phylogenetic trees. This software should be accessible to every scientist working in bioinformatics but has yet to be put out there for them because the process is not easily done. Once it is basic enough for simple execution then scientist will have a new and more efficient tool for analyzing organism's genomic sequences.
The purpose of this project is to add parallelization support to the code for multithreading PlotViz3. The code in the software uses the C++ programming language which is what we shall be using to make improvements. In the end, adding this support will speed up the virtualization process in the software and make it less time consuming when looking for results quickly and efficiently. |