Analysis Functionality to enhance MATLAB default interpolation schema using mGstat
The Center for Remote Sensing of Ice Sheets (CReSIS) has a large database of data that is examined by many researchers. This project consists of two enhancements to the CReSIS toolbox. The first, was the need for extended analysis functionality in MATLAB. The objective of this project was to enhance MATLAB's default interpolation schema by using the mGstat package for the interpolation of point data. To accomplish this we needed to download and install the mGstat package then review the mGstat documentation and functionality. We then tested the mGstat interpolation methods by using the mGstat examples and later tested the mGstat interpolation methods using CReSIS data. The second project is a JavaScript viewer for echogram data that will be integrated into the web interface for the CReSIS geospatial database.
Implementing a Snake Tool to Track the Ice Surface and Ice Bottom in a Radar Echogram
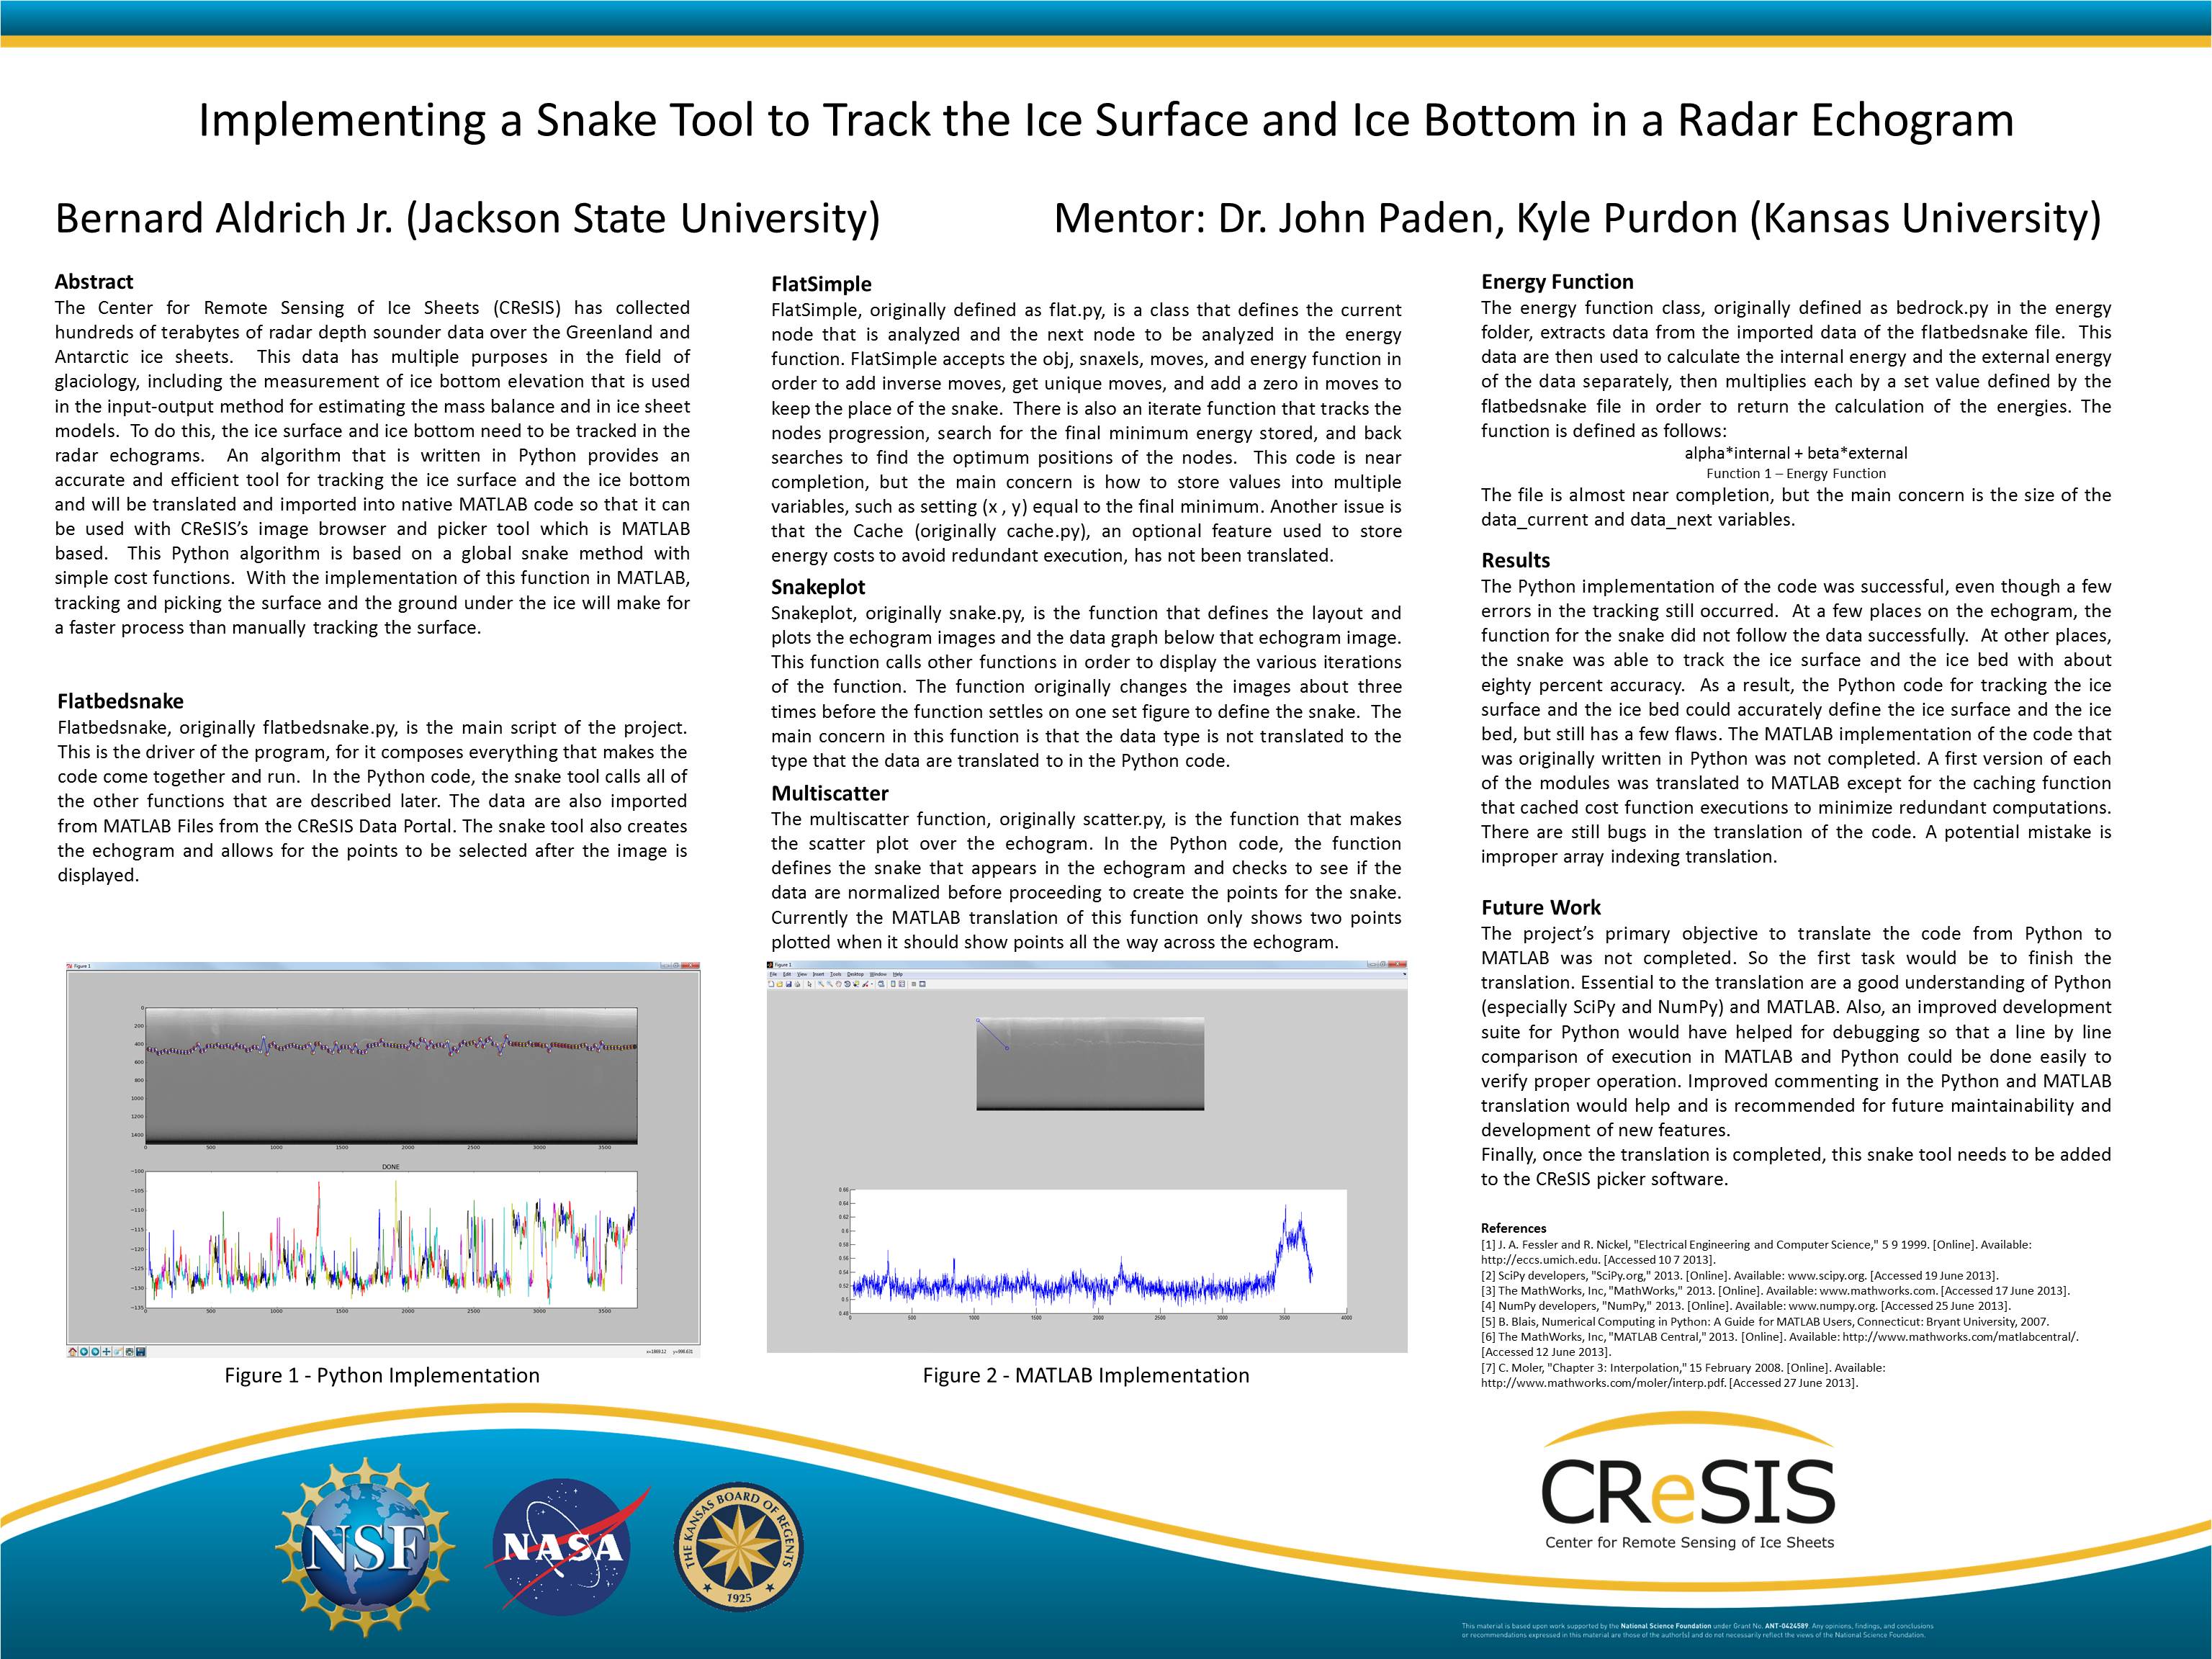
Abstract - The Center for Remote Sensing of Ice Sheets (CReSIS) has collected hundreds of terabytes of radar depth sounder data over the Greenland and Antarctic ice sheets. This data has multiple purposes in the field of glaciology, including the measurement of ice bottom elevation that is used in the input-output method for estimating the mass balance and in ice sheet models. To do this, the ice surface and ice bottom need to be tracked in the radar echograms. An algorithm that is written in Python provides an accurate and efficient tool for tracking the ice surface and the ice bottom and will be converted and imported into native MATLAB code so that it can be used with CReSIS's image browser and picker tool which is MATLAB based. This Python algorithm is based on a global snake method with simple cost functions. With the implementation of this function in MATLAB, tracking and picking the surface and the ground under the ice will make for a faster process than manually tracking the surface.
Renee Butler
Junior - Env Sci - Haskell blastside@cox.net
Mentor: Dr. David Braaten
Poster
(JPEG :: PPTX)
Accumulation Layer Picking
Radar data collected with a FWCW CReSIS radar operated on a 375 km surface traverse along the ice divide in North-Central Greenland in 2007 is being used along with ice core data along the traverse to better understand the layers detected by radar. The layers being picked are from two 10 km segments of the radar data set. The segments are deeper than 30 m to a maximum depth of 100 m and date back more than 400 years. The layers are used in a similar manner as tree rings to understand whether or not annual layers are missing and if the vertical distance between layers (slab thickness) includes more than one year of snowfall. The slab thickness is related to the annual accumulation of snowfall; thicker slabs mean more snow and thinner slabs mean less snow during the year. Nearby ice core data will be used to understand the chronology (the science of arranging events in their order of occurrence in time) of the layers. The ice core data also provides ice density profile measurements; which will be used to more accurately calculate the radar signal propagation speed through the ice. This will provide increased accuracy of determining the internal layer depths, and this increased accuracy will be quantified in my paper.
Tyler Berry
Senior - Env Sci - Haskell tyler.berry@haskell.edu
Mentor: Dr. Fernando Rodriguez-Morales
Poster
(JPEG :: PPT)
Dielectric measurements using a vector network analyzer
Sea level is strongly linked to the growth and shrinkage of the large ice sheets in Greenland and Antarctica. There is an urgent need to improve both knowledge of ice dynamics and accuracy of ice-sheet models to predict the ice-sheets' response to a warming climate and their contribution to sea level rise. A key component to improve the ice sheet models through the use and interpretation of of radar data is the knowledge of the dielectric properties of the ice. Most of the measured data on the dielectric properties of ice available today is based on measurements performed at low frequencies with the technology available in the 1960s. In this project we will design and fabricate a set of test fixtures to characterize permittivity of dielectric materials using a network analyzer. One technique to be used relies on a planar transmission line in contact with the sample. The second technique relies on an open ended coaxial transmission line in contact with the sample. These methods will serve as a basis for dielectric measurements on dielectric materials in the 60-600 MHz range and will be used as a test bench for future measurements on ice cores.
Measurements and simulations for the optimization of a microwave FMCW radar
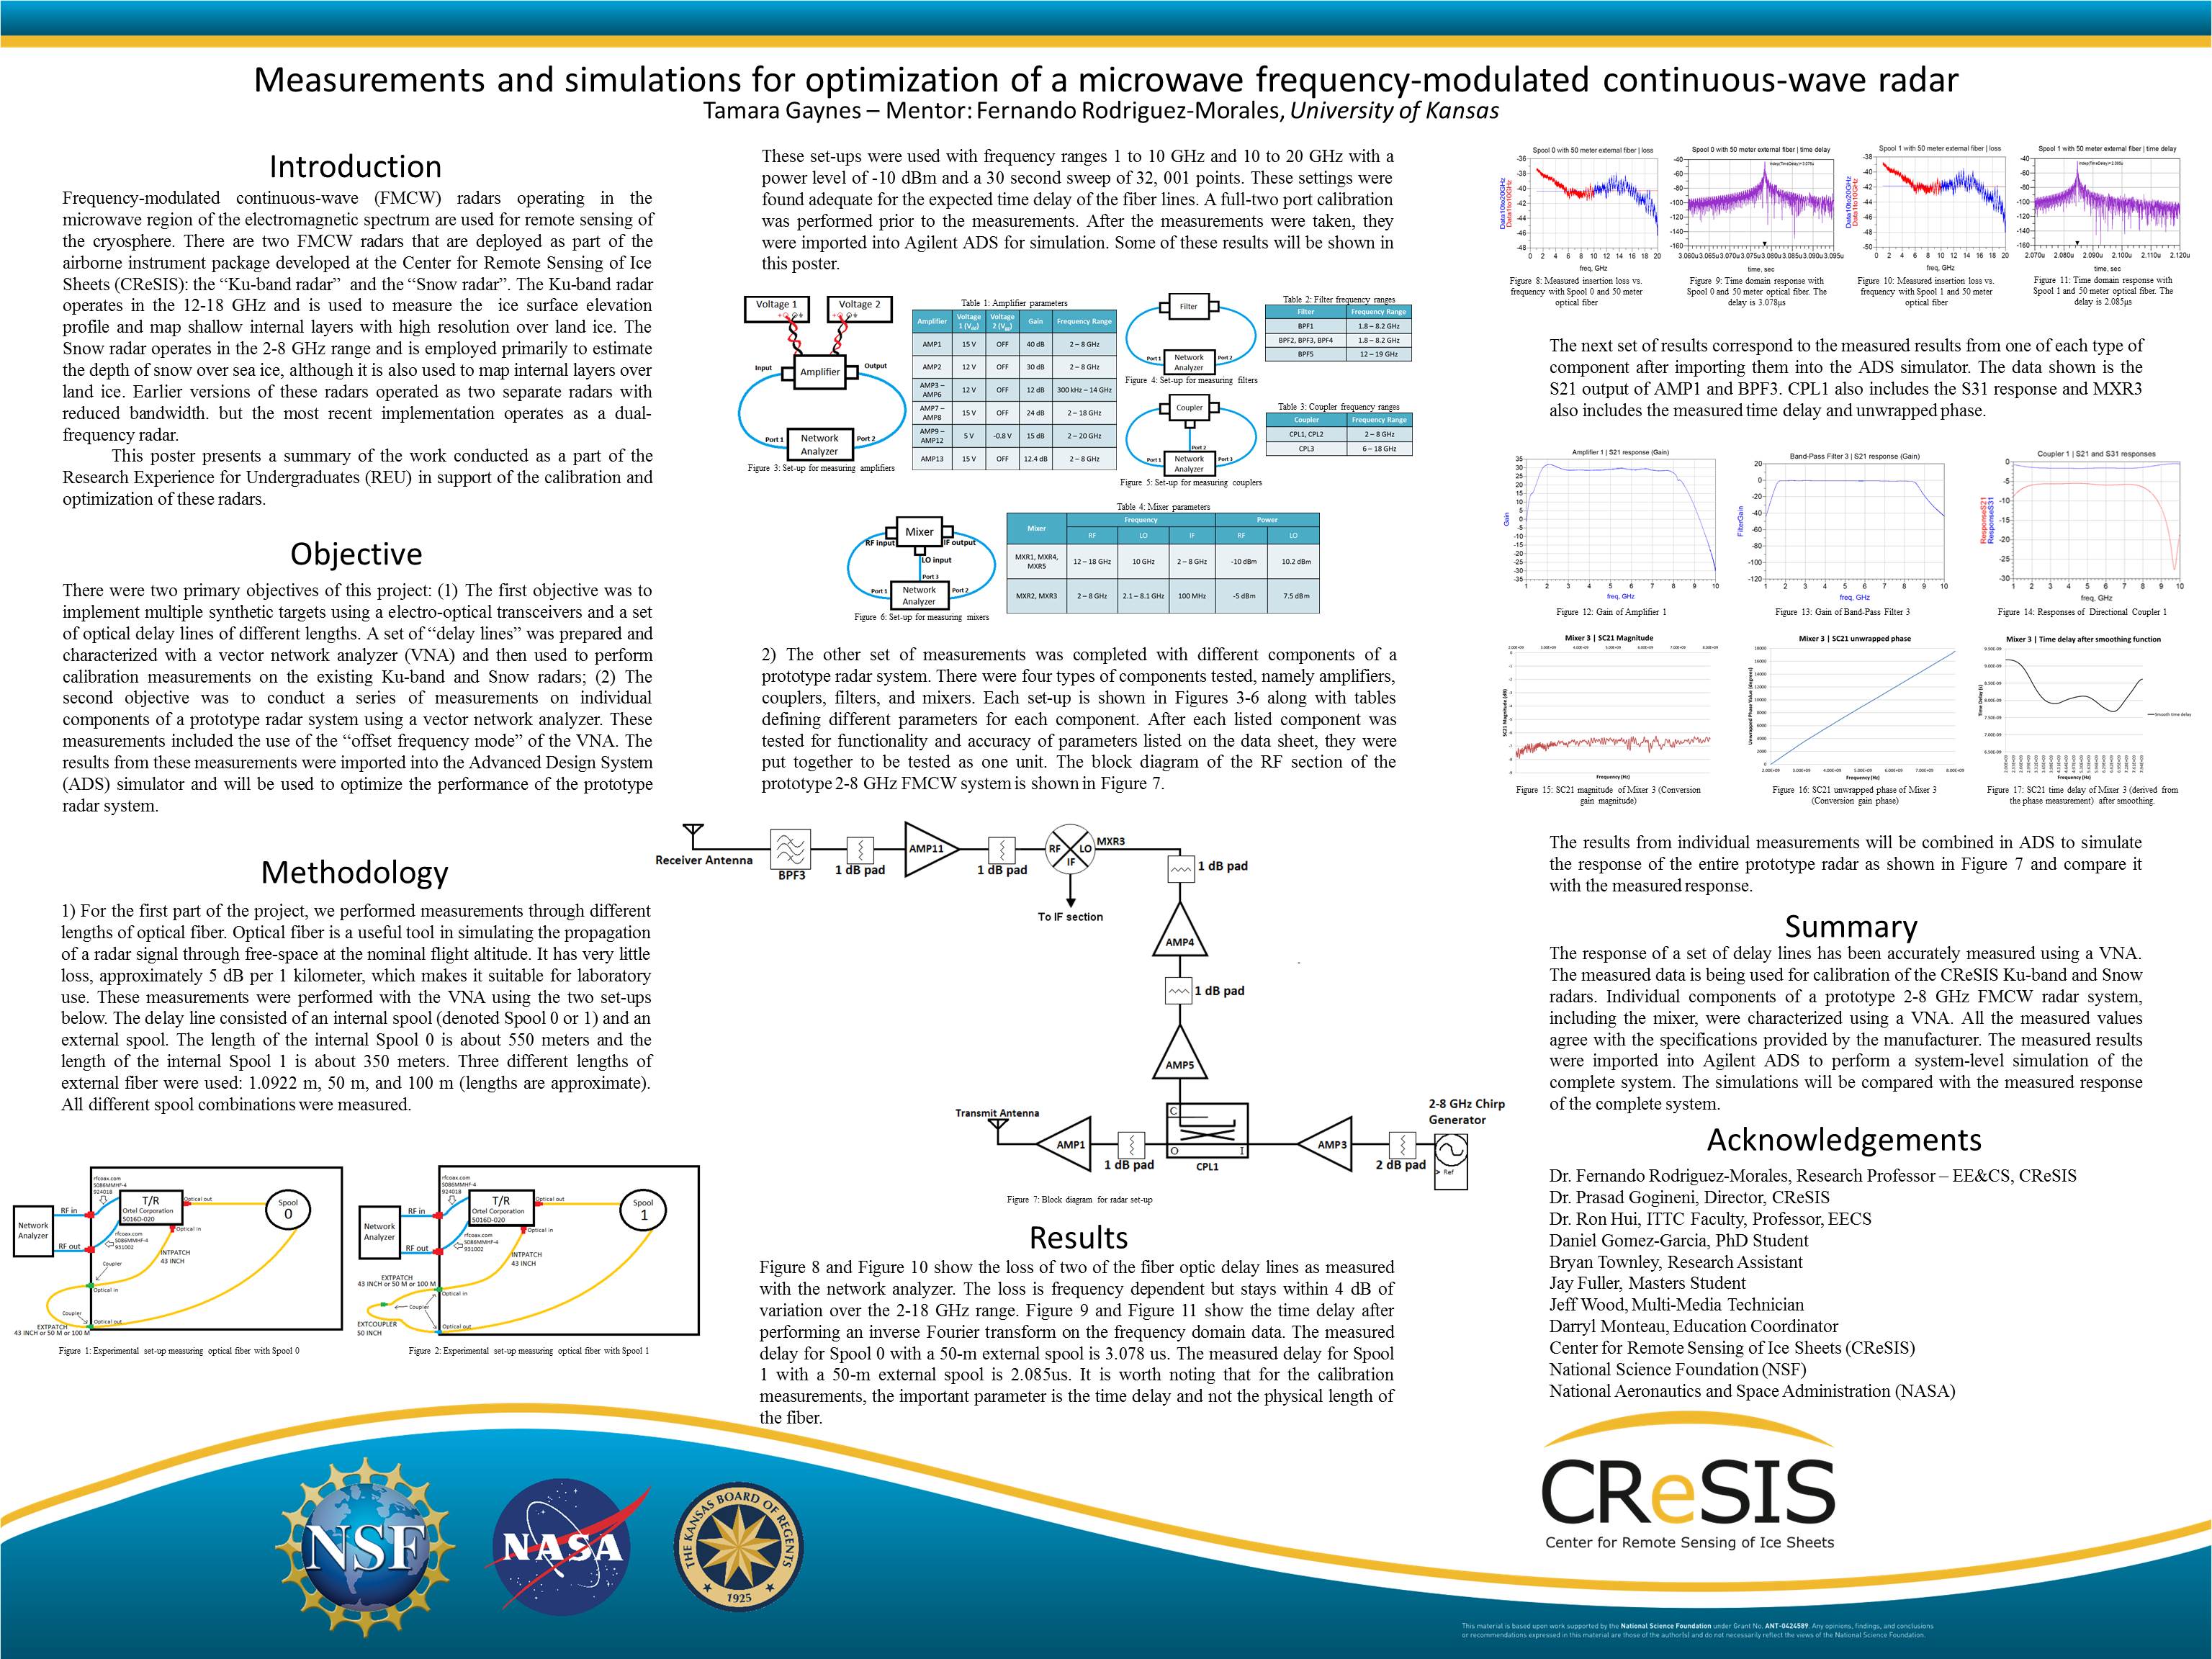
This project is related to the optimization of a frequency-modulated continuous wave (FMCW) radar. This will be accomplished by performing measurements using a vector network analyzer (VNA) and computer simulations to characterize the response of both the radar components and the radar system. CReSIS uses FMCW airborne-radar to measure surface elevation, snow cover thickness over sea ice, and internal layers over land ice in Antarctica and Greenland.
Calibration measurements will be performed using a target built with an electro-optical transceiver attached to fiber optic delay lines of various lengths. This will be done to simulate operation at different elevations over the target and assess how the response of the radar changes with range. The measured response of the transmitter and receiver chains and delay line targets will be imported into Agilent Advanced Design System (ADS) and Genesys and used to simulate the actual response of the radar. The simulation results will be compared with the measured results. In the end, all of this information will be used to determine how to improve the operation and calibration of the radar to produce the most accurate measurements. This project will require learning about radar systems and the use of the VNA; computer aided design (CAD) tools and simulations.
:: Center of Excellence in Remote Sensing Education and Research | ECSU | 1704 Weeksville Road | Elizabeth City, NC 27909 ::


