URE OMSS 2006
Antarctic Temperature Mapping May 2006 to July 2006
Firn is compacted, near-surface snow enduring for
more than one season not yet compressed into glacial ice.
Knowledge of firn surface temperature trends across the Antarctic
ice sheet is useful for documenting and quantifying change
and providing a temporal and spatial context for research
during the Antarctic International Polar Year (IPY). Satellite
passive microwave radiometer data can provide surface temperature
trend estimates across limited temporal and spatial gaps in
Automatic Weather Station (AWS) coverage. Techniques to derive
surface temperatures from passive microwave data have been
pioneered by Jezek et al., (1993) and. Shuman et al., (1995).
Using the methods of previous researchers, the Summer 2006
Undergraduate Research Experience (URE) Antarctic Temperature
Mapping Team, compared archived surface temperature data from
an AWS on the West Antarctic Ice Sheet with coincident daily
brightness temperature data collected by the Special Sensor
Microwave Imager (SSM/I) aboard the Defense Meteorology Satellite
Program (DMSP) polar orbiting meteorology satellite series.
The ratio of passive microwave brightness temperature and
AWS in-situ near surface temperature provides the firn emissivity
estimate necessary to extrapolate surface temperature trends
across temporal and spatial gaps in either the AWS or SSM/I
record. The relationship between emissivity and surface temperature
is generally known as the “Rayleigh-Jeans Approximation”
(Hall and Martinec, 1985). The spatial and temporal variability
of firn emissivity is not well understood but known to be
much less variable than daily temperature.
2005-2006
Multimedia Research Team Automated Approach of Cataloguing
TeraScan Images utilizing Exchangeable Image File Format (EXIF)
Data
ABSTRACT
Automated Approach of Cataloguing TeraScan Images utilizing Exchangeable Image File Format (EXIF) Data The Center of Excellence in Remote Sensing Education and Research (CERSER) on the campus of Elizabeth City State University is currently tasked with the responsibility of receiving remotely sensed Advanced Very High Resolution Radiometer (AVHRR) and Sea Wide Field-of-View Sensor (SeaWiFS) data for research projects year round. This data is collected, processed, annotated, and transformed into images in the Tagged Image File Format (tiff). These tiff images are then uploaded to the CERSER archive library server located at http://cerser.ecsu.edu. Once uploaded, they are converted into various resolutions and their information is added to a tracking database maintained with Microsoft Access software. This database provides a searchable means for retrieving satellite image data through various parameters. The conversion of the tiff file to its various resolutions and the entry of data into the tracking database are currently done manually by the CERSER webmaster. The amount of time to enter one image into the system is approximately ten minutes. The process is also limited by the requirement that the webmaster be located at one computer terminal located on the campus to perform these tasks. The goal of the 2005 ONR Multimedia Team (MMT) is to automate this process utilizing data captured from the tiff files Exchangeable Image File Format (EXIF) data. This data contains the capture time and date along with file resolution and file size. Utilizing this information will allow various scripts to be written eliminating the necessity for the manual conversions and data input to be made resulting in a more up to date and accurate archiving system of the images. Various methods and languages will be utilized including Java, JavaScript, and Adobe Photoshop Action Scripts to complete this process.
---------------------------------------------------------------------------
Summer 2005 Beaufort Stock Assessment
Research Poster (JPG)
Dr. M. Prager Page Abstract
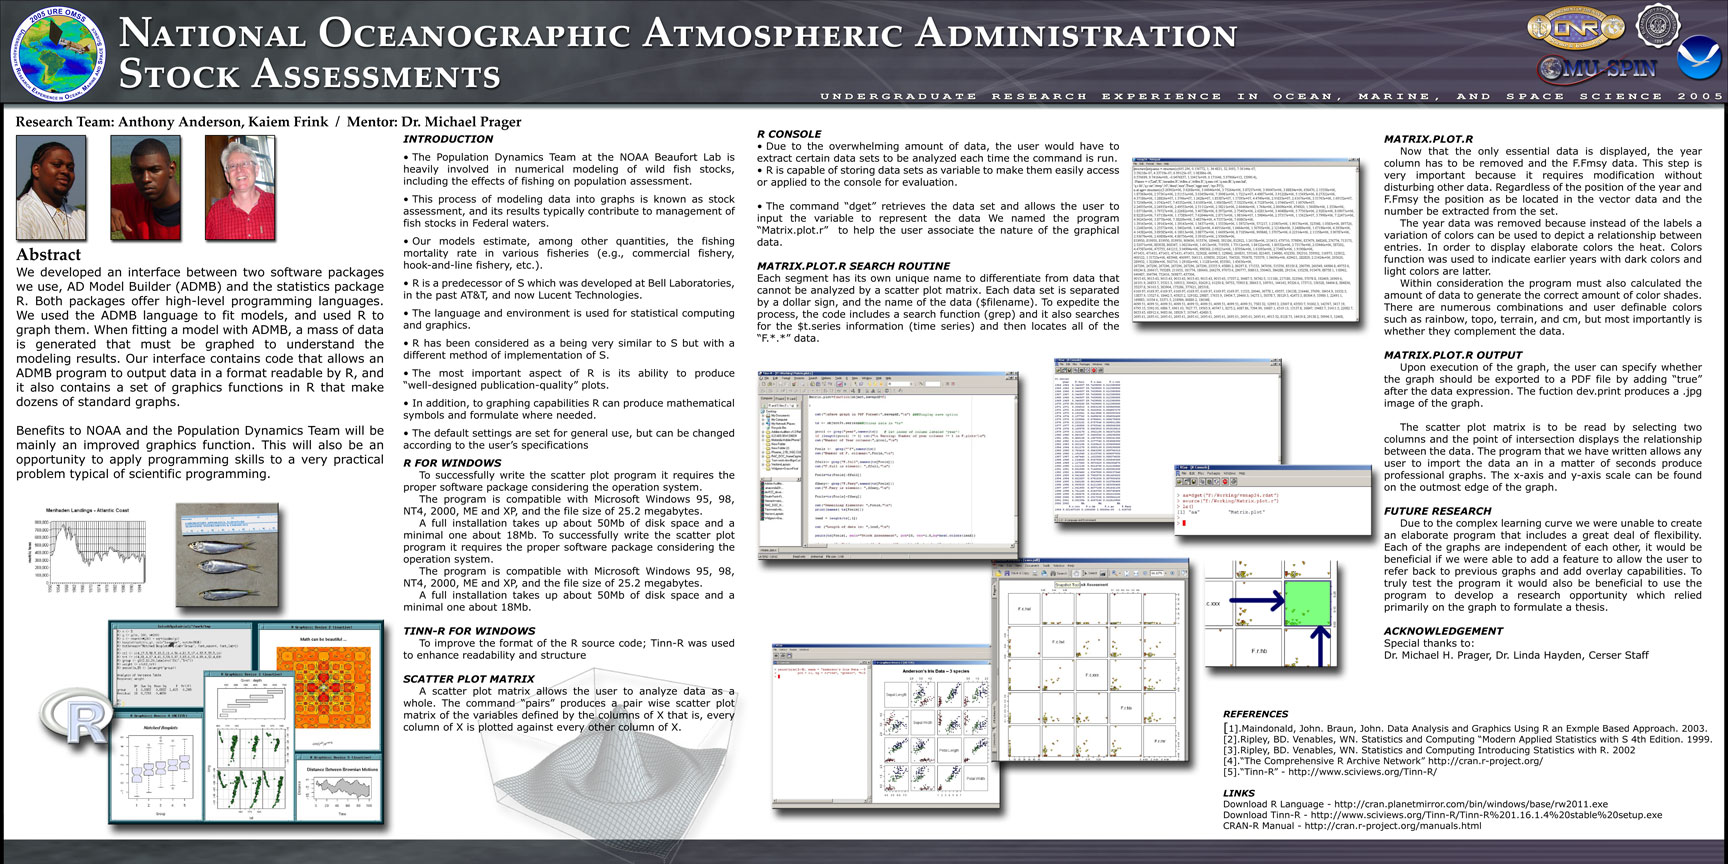
This internship involved the development of a graphical user interface between two software packages, AD Model Builder (ADMB) and the statistics package R. The ADMB software was used to fit models and then R was used to graph them. ADMB generates a large amount of data that must be graphed in order to obtain representative results. The interface developed allows an ADMB program to output data in a format readable by R. The interface also contains a set of graphic functions in R that formulate many common graphs.
The benefits to NOAA and the Population Dynamics Team is an improved graphics function. This internship increased familiarity in general with scientific programming and particularly with the R language.
---------------------------------------------------------------------------
Acadmic year 2004-2005 Multimedia Research Team
Study on Implementation of Macromedia ColdFusion as a Web Application ServerStudy on Implementation of Macromedia ColdFusion as a Web Application Server
Abstract
The ONR 2004-2005 Multimedia Research Team studied the implementation of Macromedia’s ColdFusion Server software as a web application server for small scale online databases. ColdFusion is utilized by the ECSU staff and integrates with the current Macromedia tools employed by the ONR media developers. The team’s goal was to utilize the University server's ColdFusion software for the implementation of a small, startup site. This site involved documenting the Submerged Aquatic Vegetation (SAV) Herbarium of Northeast North Carolina waters for the ECSU Geological, Environmental, and Marine Sciences (GEMS) department. The team developed the initial site with database files in place to begin the recording of information. The future phases of will include the insertion, manipulation, and retrieval of actual gathered data. This project sought to research the learning curve, integration, and ease of use of the ColdFusion software in comparison with other web application software. |
