
| GIS Day | CERSER | NIA | ECSU |
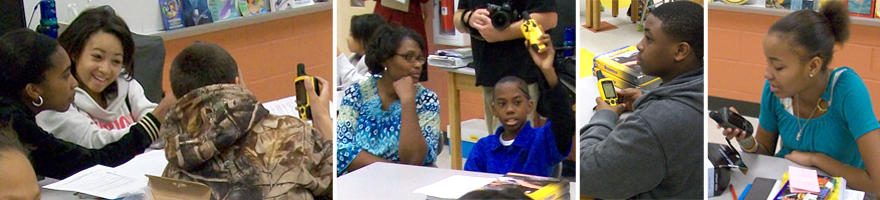
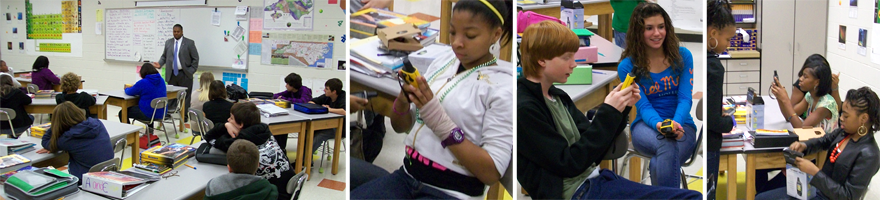
GIS Day at Elizabeth City Middle School on November 17, 2010 |
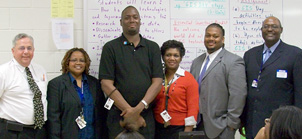
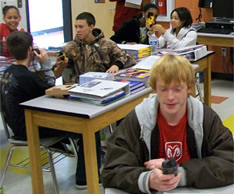 GIS Day in Mr. Darrell Walker’s eighth grade science classes was a success for both these inquiring middle school students at Elizabeth City Middle School and the STEM representatives from Elizabeth City State University. For graduate student, Kaiem Frink and Education Coordinator for the Center for the Remote Sensing of Ice Sheets (CReSIS) at ECSU, Dr. Darnell Johnson, getting global positioning systems into the hands of students is a small part of a much bigger picture. The science community at ECSU wanted to bring that first-class science and let them know that they can compete internationally in the science community. Too often, students who live in rural communities or face economic disadvantages often miss out on getting access to important technology. The goal of last week's visit to Mr. Walker's classroom was to get students thinking about existing technology, and ideally, get them thinking about a career path they might have overlooked, a field that requires some combination of science, technology, engineering and mathematics. In Europe and other countries they are exposing students to science, and the United States needs to be proactive as well. If only a few students from each of Mr. Walker's science classes developed an interest in the STEM fields, this class visit would be considered a total success for the city, community, country, and world. GIS Day in Mr. Darrell Walker’s eighth grade science classes was a success for both these inquiring middle school students at Elizabeth City Middle School and the STEM representatives from Elizabeth City State University. For graduate student, Kaiem Frink and Education Coordinator for the Center for the Remote Sensing of Ice Sheets (CReSIS) at ECSU, Dr. Darnell Johnson, getting global positioning systems into the hands of students is a small part of a much bigger picture. The science community at ECSU wanted to bring that first-class science and let them know that they can compete internationally in the science community. Too often, students who live in rural communities or face economic disadvantages often miss out on getting access to important technology. The goal of last week's visit to Mr. Walker's classroom was to get students thinking about existing technology, and ideally, get them thinking about a career path they might have overlooked, a field that requires some combination of science, technology, engineering and mathematics. In Europe and other countries they are exposing students to science, and the United States needs to be proactive as well. If only a few students from each of Mr. Walker's science classes developed an interest in the STEM fields, this class visit would be considered a total success for the city, community, country, and world. |
 |
ABOUT GIS
After clearly defining the problem, it is necessary to determine the data needed to complete your analysis and ascertain where that data can be found or generated. The type of data and the geographic scope of your project will help direct your methods of collecting data and conducting the analysis. If the method of analysis requires detailed and/or high-level information, it may be necessary to create or calculate the new data. Creating new data may simply mean calculating new values in the data table or obtaining new map layers or attributes but may also require geo-processing. You will not know for certain whether the data you have acquired is appropriate for your study until you thoroughly examine it. This includes visual inspection, as well as investigating how the data is organized (its schema), how well the data corresponds to other datasets and the rules of the physical world (its topology), and the story of where the data came from (its metadata).
The results and presentation of the analysis are important parts of The Geographic Approach. The results can be shared through reports, maps, tables, and charts and delivered in printed form or digitally over a network or on the Web. You need to decide on the best means for presenting your analysis. You can compare the results from different analyses and see which method presents the information most accurately. And you can tailor the results for different audiences. For example, one audience might require a conventional report that summarizes the analyses and conveys recommendations or comparable alternatives. Another audience may need an interactive format that allows them to ask what-if questions or pursue additional analysis. |
 |
 Geography is the science of our world. Coupled with GIS, geography is helping us to better understand the earth and apply geographic knowledge to a host of human activities. The outcome is the emergence of The Geographic Approach—a new way of thinking and problem solving that integrates geographic information into how we understand and manage our planet. This approach allows us to create geographic knowledge by measuring the earth, organizing this data, and analyzing and modeling various processes and their relationships. The Geographic Approach also allows us to apply this knowledge to the way we design, plan, and change our world. There are basically five steps to this approach: Ask, Acquire, Examine, Analyze, and Act.
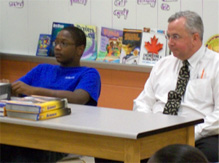 The data is processed and analyzed based on the method of examination or analysis you choose, which is dependent on the results you hope to achieve. Do not underestimate the power of "eyeballing" the data. Looking at the results can help you decide whether the information is valid or useful, or whether you should rerun the analysis using different parameters or even a different method. GIS modeling tools make it relatively easy to make these changes and create new output.